Immigrants from Bosnia and Herzegovina vs Carpatho Rusyn Ambulatory Disability
COMPARE
Immigrants from Bosnia and Herzegovina
Carpatho Rusyn
Ambulatory Disability
Ambulatory Disability Comparison
Immigrants from Bosnia and Herzegovina
Carpatho Rusyns
6.2%
AMBULATORY DISABILITY
37.2/ 100
METRIC RATING
185th/ 347
METRIC RANK
6.2%
AMBULATORY DISABILITY
35.3/ 100
METRIC RATING
187th/ 347
METRIC RANK
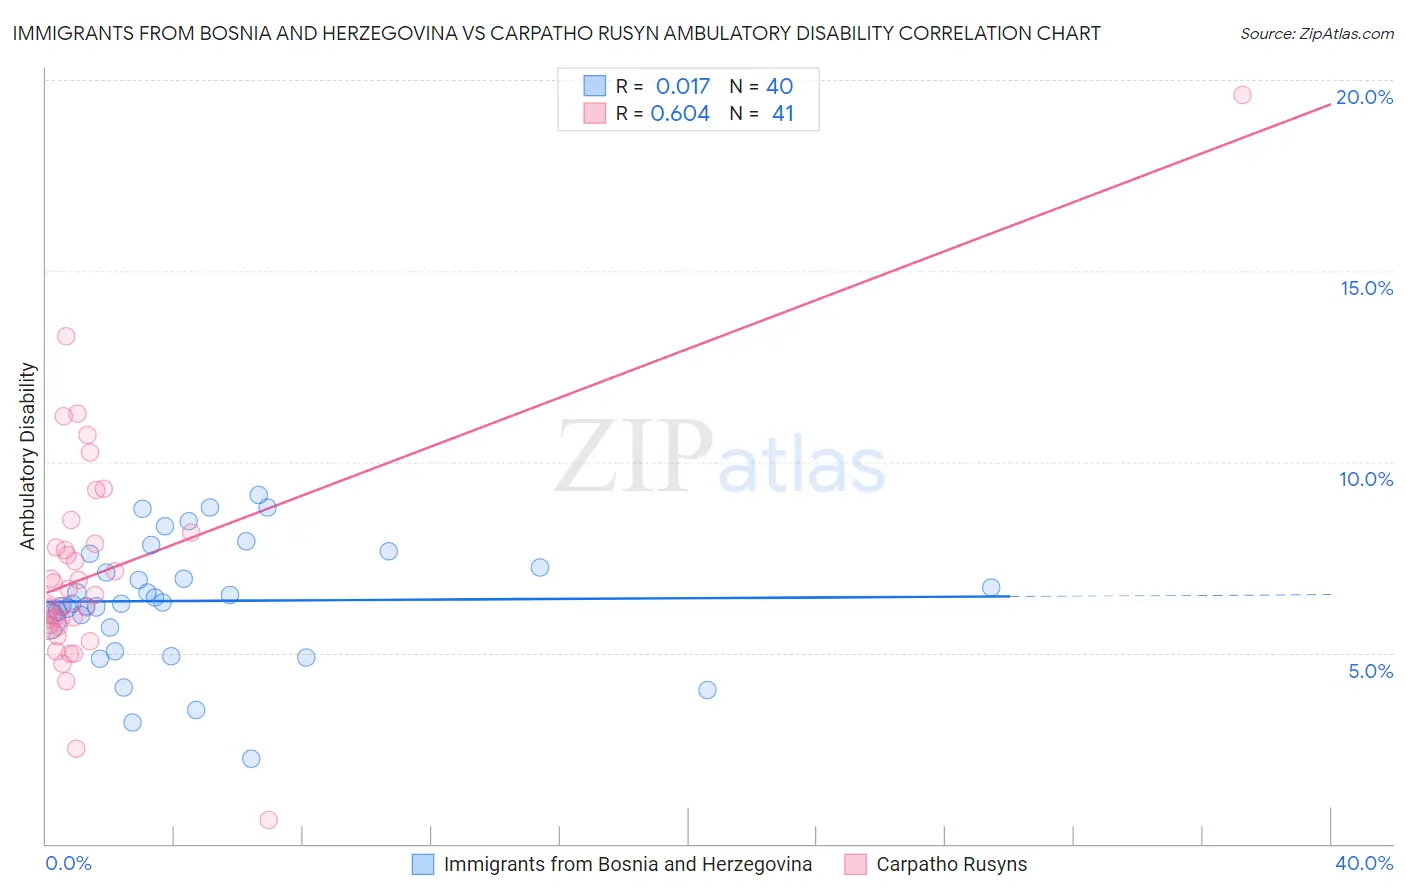
Immigrants from Bosnia and Herzegovina vs Carpatho Rusyn Ambulatory Disability Correlation Chart
The statistical analysis conducted on geographies consisting of 156,818,181 people shows no correlation between the proportion of Immigrants from Bosnia and Herzegovina and percentage of population with ambulatory disability in the United States with a correlation coefficient (R) of 0.017 and weighted average of 6.2%. Similarly, the statistical analysis conducted on geographies consisting of 58,871,605 people shows a significant positive correlation between the proportion of Carpatho Rusyns and percentage of population with ambulatory disability in the United States with a correlation coefficient (R) of 0.604 and weighted average of 6.2%, a difference of 0.11%.
Ambulatory Disability Correlation Summary
| Measurement | Immigrants from Bosnia and Herzegovina | Carpatho Rusyn |
| Minimum | 2.2% | 0.63% |
| Maximum | 9.1% | 19.6% |
| Range | 6.9% | 19.0% |
| Mean | 6.4% | 7.2% |
| Median | 6.3% | 6.5% |
| Interquartile 25% (IQ1) | 5.8% | 5.7% |
| Interquartile 75% (IQ3) | 7.4% | 8.0% |
| Interquartile Range (IQR) | 1.7% | 2.3% |
| Standard Deviation (Sample) | 1.6% | 3.1% |
| Standard Deviation (Population) | 1.6% | 3.0% |
Demographics Similar to Immigrants from Bosnia and Herzegovina and Carpatho Rusyns by Ambulatory Disability
In terms of ambulatory disability, the demographic groups most similar to Immigrants from Bosnia and Herzegovina are European (6.2%, a difference of 0.060%), British (6.2%, a difference of 0.17%), Ukrainian (6.2%, a difference of 0.19%), Immigrants from Ghana (6.1%, a difference of 0.22%), and Immigrants from Western Africa (6.2%, a difference of 0.22%). Similarly, the demographic groups most similar to Carpatho Rusyns are European (6.2%, a difference of 0.050%), British (6.2%, a difference of 0.060%), Ukrainian (6.2%, a difference of 0.080%), Immigrants from Western Africa (6.2%, a difference of 0.12%), and Immigrants from Guatemala (6.2%, a difference of 0.20%).
| Demographics | Rating | Rank | Ambulatory Disability |
| Immigrants | North America | 45.6 /100 | #176 | Average 6.1% |
| Immigrants | England | 45.4 /100 | #177 | Average 6.1% |
| Scandinavians | 44.5 /100 | #178 | Average 6.1% |
| Austrians | 44.1 /100 | #179 | Average 6.1% |
| Immigrants | Nicaragua | 43.9 /100 | #180 | Average 6.1% |
| Swiss | 43.1 /100 | #181 | Average 6.1% |
| Serbians | 42.8 /100 | #182 | Average 6.1% |
| Immigrants | Thailand | 42.2 /100 | #183 | Average 6.1% |
| Immigrants | Ghana | 41.2 /100 | #184 | Average 6.1% |
| Immigrants | Bosnia and Herzegovina | 37.2 /100 | #185 | Fair 6.2% |
| Europeans | 36.2 /100 | #186 | Fair 6.2% |
| Carpatho Rusyns | 35.3 /100 | #187 | Fair 6.2% |
| British | 34.3 /100 | #188 | Fair 6.2% |
| Ukrainians | 34.0 /100 | #189 | Fair 6.2% |
| Immigrants | Western Africa | 33.4 /100 | #190 | Fair 6.2% |
| Immigrants | Guatemala | 31.9 /100 | #191 | Fair 6.2% |
| Immigrants | Western Europe | 31.6 /100 | #192 | Fair 6.2% |
| Guatemalans | 30.0 /100 | #193 | Fair 6.2% |
| Alaska Natives | 29.8 /100 | #194 | Fair 6.2% |
| Belgians | 28.6 /100 | #195 | Fair 6.2% |
| Malaysians | 28.2 /100 | #196 | Fair 6.2% |