Immigrants from Belgium vs Immigrants from Singapore Hearing Disability
COMPARE
Immigrants from Belgium
Immigrants from Singapore
Hearing Disability
Hearing Disability Comparison
Immigrants from Belgium
Immigrants from Singapore
3.0%
HEARING DISABILITY
41.5/ 100
METRIC RATING
181st/ 347
METRIC RANK
2.6%
HEARING DISABILITY
99.3/ 100
METRIC RATING
48th/ 347
METRIC RANK
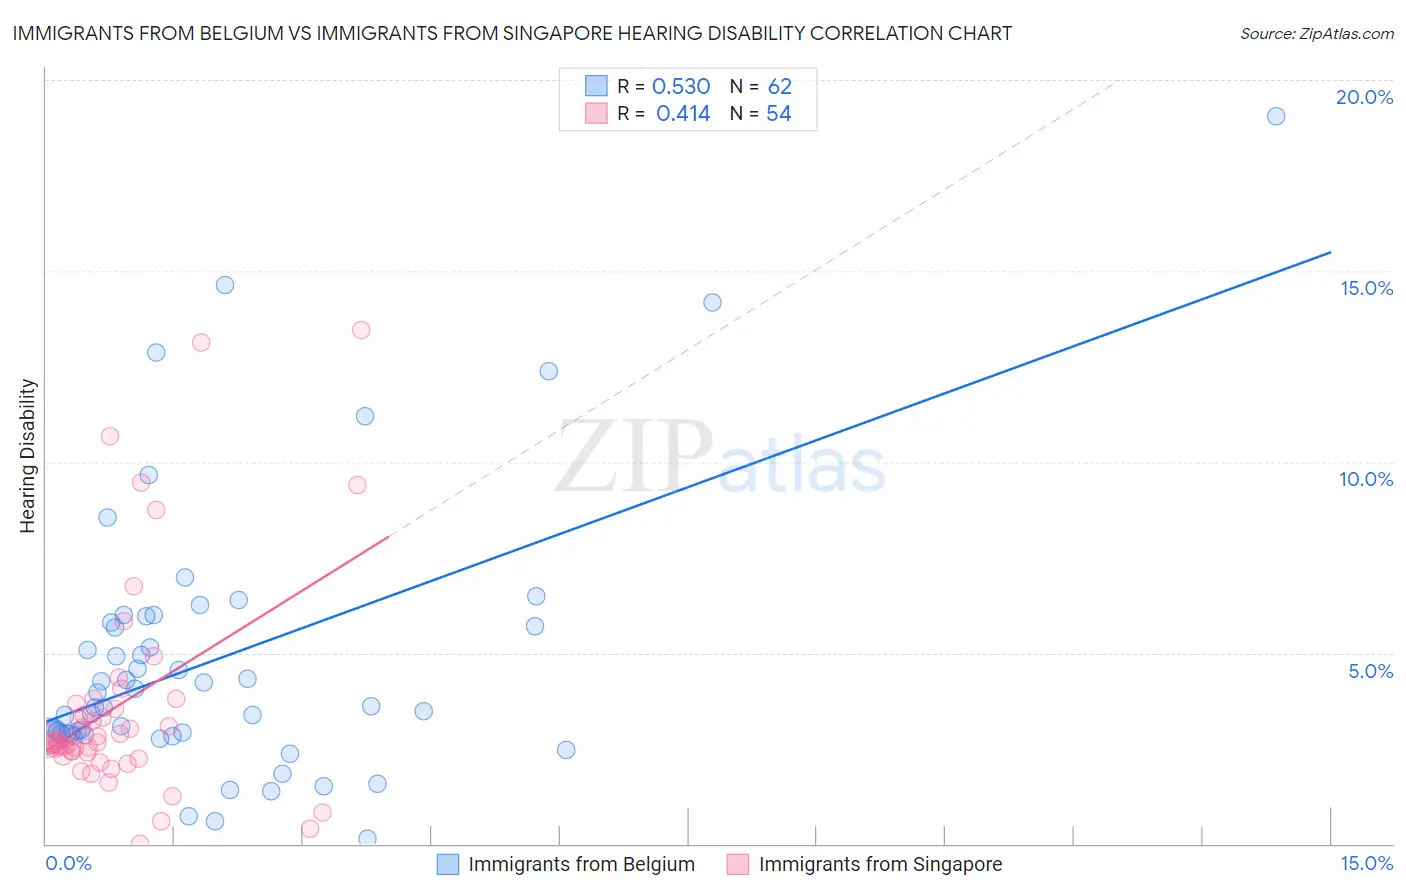
Immigrants from Belgium vs Immigrants from Singapore Hearing Disability Correlation Chart
The statistical analysis conducted on geographies consisting of 146,709,031 people shows a substantial positive correlation between the proportion of Immigrants from Belgium and percentage of population with hearing disability in the United States with a correlation coefficient (R) of 0.530 and weighted average of 3.0%. Similarly, the statistical analysis conducted on geographies consisting of 137,507,103 people shows a moderate positive correlation between the proportion of Immigrants from Singapore and percentage of population with hearing disability in the United States with a correlation coefficient (R) of 0.414 and weighted average of 2.6%, a difference of 13.9%.
Hearing Disability Correlation Summary
| Measurement | Immigrants from Belgium | Immigrants from Singapore |
| Minimum | 0.12% | 0.0083% |
| Maximum | 19.0% | 13.5% |
| Range | 18.9% | 13.5% |
| Mean | 4.8% | 3.6% |
| Median | 3.6% | 2.7% |
| Interquartile 25% (IQ1) | 2.9% | 2.4% |
| Interquartile 75% (IQ3) | 5.8% | 3.7% |
| Interquartile Range (IQR) | 2.9% | 1.3% |
| Standard Deviation (Sample) | 3.6% | 2.9% |
| Standard Deviation (Population) | 3.6% | 2.8% |
Similar Demographics by Hearing Disability
Demographics Similar to Immigrants from Belgium by Hearing Disability
In terms of hearing disability, the demographic groups most similar to Immigrants from Belgium are Immigrants from Italy (3.0%, a difference of 0.030%), Immigrants from Sweden (3.0%, a difference of 0.090%), Immigrants from Moldova (3.0%, a difference of 0.15%), Bulgarian (3.0%, a difference of 0.17%), and Immigrants from Ireland (3.0%, a difference of 0.40%).
| Demographics | Rating | Rank | Hearing Disability |
| Indonesians | 50.0 /100 | #174 | Average 3.0% |
| Immigrants | Romania | 48.4 /100 | #175 | Average 3.0% |
| Panamanians | 47.0 /100 | #176 | Average 3.0% |
| Immigrants | Philippines | 46.4 /100 | #177 | Average 3.0% |
| Japanese | 46.0 /100 | #178 | Average 3.0% |
| Immigrants | Moldova | 43.1 /100 | #179 | Average 3.0% |
| Immigrants | Sweden | 42.4 /100 | #180 | Average 3.0% |
| Immigrants | Belgium | 41.5 /100 | #181 | Average 3.0% |
| Immigrants | Italy | 41.1 /100 | #182 | Average 3.0% |
| Bulgarians | 39.7 /100 | #183 | Fair 3.0% |
| Immigrants | Ireland | 37.4 /100 | #184 | Fair 3.0% |
| Immigrants | Southern Europe | 35.3 /100 | #185 | Fair 3.0% |
| Immigrants | Mexico | 34.9 /100 | #186 | Fair 3.0% |
| Blacks/African Americans | 34.7 /100 | #187 | Fair 3.0% |
| Mexican American Indians | 34.7 /100 | #188 | Fair 3.0% |
Demographics Similar to Immigrants from Singapore by Hearing Disability
In terms of hearing disability, the demographic groups most similar to Immigrants from Singapore are Immigrants from Israel (2.6%, a difference of 0.070%), Immigrants from South America (2.7%, a difference of 0.12%), Immigrants from Dominica (2.6%, a difference of 0.21%), Paraguayan (2.7%, a difference of 0.31%), and Venezuelan (2.6%, a difference of 0.32%).
| Demographics | Rating | Rank | Hearing Disability |
| Immigrants | Taiwan | 99.4 /100 | #41 | Exceptional 2.6% |
| West Indians | 99.4 /100 | #42 | Exceptional 2.6% |
| Senegalese | 99.4 /100 | #43 | Exceptional 2.6% |
| Nigerians | 99.4 /100 | #44 | Exceptional 2.6% |
| Venezuelans | 99.4 /100 | #45 | Exceptional 2.6% |
| Immigrants | Dominica | 99.3 /100 | #46 | Exceptional 2.6% |
| Immigrants | Israel | 99.3 /100 | #47 | Exceptional 2.6% |
| Immigrants | Singapore | 99.3 /100 | #48 | Exceptional 2.6% |
| Immigrants | South America | 99.2 /100 | #49 | Exceptional 2.7% |
| Paraguayans | 99.2 /100 | #50 | Exceptional 2.7% |
| Immigrants | Hong Kong | 99.2 /100 | #51 | Exceptional 2.7% |
| Jamaicans | 99.0 /100 | #52 | Exceptional 2.7% |
| Immigrants | Eastern Asia | 99.0 /100 | #53 | Exceptional 2.7% |
| Ethiopians | 99.0 /100 | #54 | Exceptional 2.7% |
| Immigrants | Ethiopia | 99.0 /100 | #55 | Exceptional 2.7% |