Immigrants from Belgium vs Bolivian Hearing Disability
COMPARE
Immigrants from Belgium
Bolivian
Hearing Disability
Hearing Disability Comparison
Immigrants from Belgium
Bolivians
3.0%
HEARING DISABILITY
41.5/ 100
METRIC RATING
181st/ 347
METRIC RANK
2.6%
HEARING DISABILITY
99.7/ 100
METRIC RATING
29th/ 347
METRIC RANK
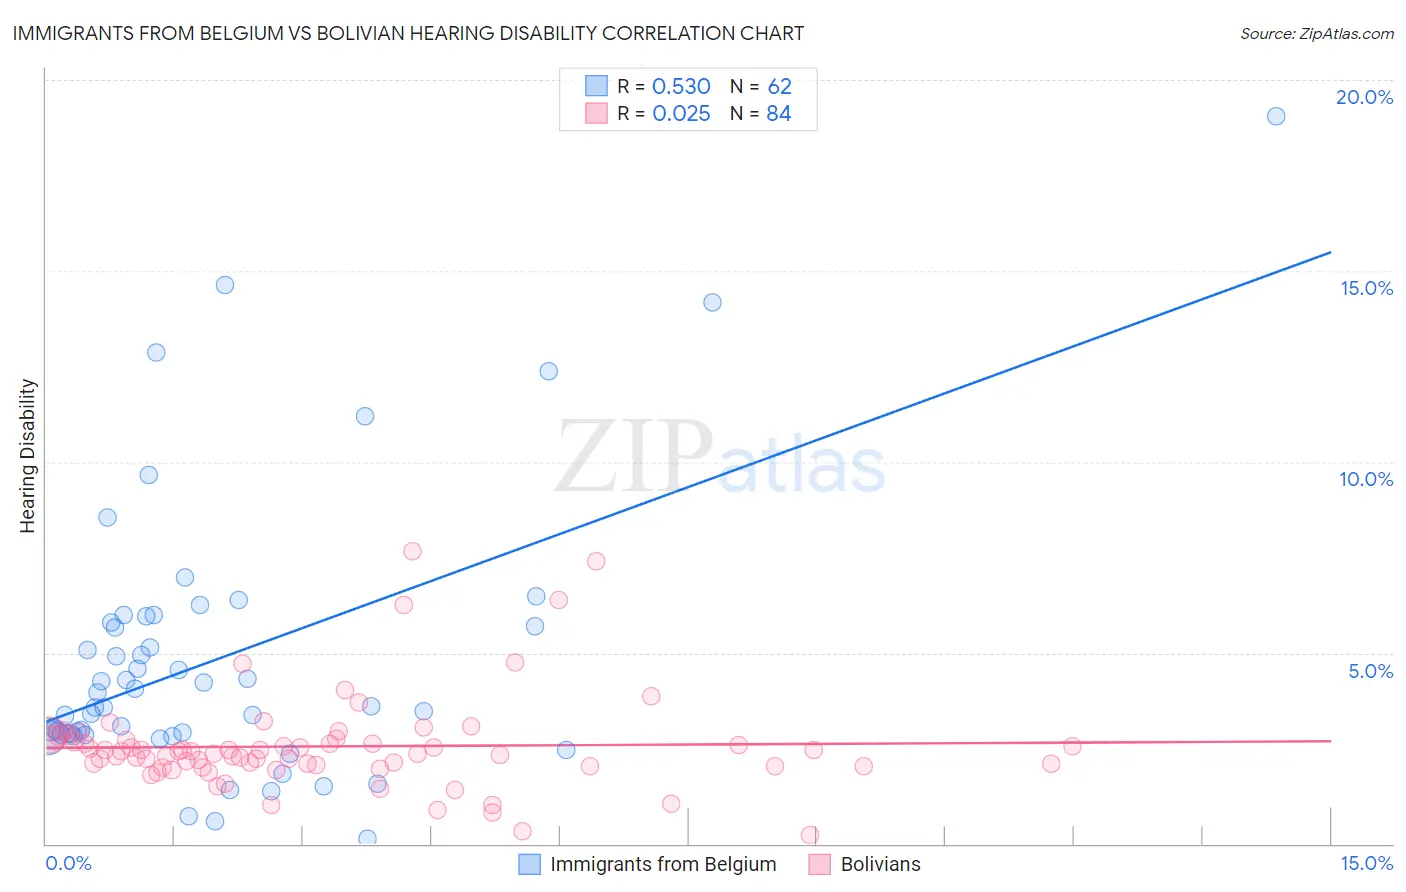
Immigrants from Belgium vs Bolivian Hearing Disability Correlation Chart
The statistical analysis conducted on geographies consisting of 146,709,031 people shows a substantial positive correlation between the proportion of Immigrants from Belgium and percentage of population with hearing disability in the United States with a correlation coefficient (R) of 0.530 and weighted average of 3.0%. Similarly, the statistical analysis conducted on geographies consisting of 184,637,856 people shows no correlation between the proportion of Bolivians and percentage of population with hearing disability in the United States with a correlation coefficient (R) of 0.025 and weighted average of 2.6%, a difference of 16.5%.
Hearing Disability Correlation Summary
| Measurement | Immigrants from Belgium | Bolivian |
| Minimum | 0.12% | 0.24% |
| Maximum | 19.0% | 7.7% |
| Range | 18.9% | 7.4% |
| Mean | 4.8% | 2.5% |
| Median | 3.6% | 2.4% |
| Interquartile 25% (IQ1) | 2.9% | 2.0% |
| Interquartile 75% (IQ3) | 5.8% | 2.7% |
| Interquartile Range (IQR) | 2.9% | 0.70% |
| Standard Deviation (Sample) | 3.6% | 1.2% |
| Standard Deviation (Population) | 3.6% | 1.2% |
Similar Demographics by Hearing Disability
Demographics Similar to Immigrants from Belgium by Hearing Disability
In terms of hearing disability, the demographic groups most similar to Immigrants from Belgium are Immigrants from Italy (3.0%, a difference of 0.030%), Immigrants from Sweden (3.0%, a difference of 0.090%), Immigrants from Moldova (3.0%, a difference of 0.15%), Bulgarian (3.0%, a difference of 0.17%), and Immigrants from Ireland (3.0%, a difference of 0.40%).
| Demographics | Rating | Rank | Hearing Disability |
| Indonesians | 50.0 /100 | #174 | Average 3.0% |
| Immigrants | Romania | 48.4 /100 | #175 | Average 3.0% |
| Panamanians | 47.0 /100 | #176 | Average 3.0% |
| Immigrants | Philippines | 46.4 /100 | #177 | Average 3.0% |
| Japanese | 46.0 /100 | #178 | Average 3.0% |
| Immigrants | Moldova | 43.1 /100 | #179 | Average 3.0% |
| Immigrants | Sweden | 42.4 /100 | #180 | Average 3.0% |
| Immigrants | Belgium | 41.5 /100 | #181 | Average 3.0% |
| Immigrants | Italy | 41.1 /100 | #182 | Average 3.0% |
| Bulgarians | 39.7 /100 | #183 | Fair 3.0% |
| Immigrants | Ireland | 37.4 /100 | #184 | Fair 3.0% |
| Immigrants | Southern Europe | 35.3 /100 | #185 | Fair 3.0% |
| Immigrants | Mexico | 34.9 /100 | #186 | Fair 3.0% |
| Blacks/African Americans | 34.7 /100 | #187 | Fair 3.0% |
| Mexican American Indians | 34.7 /100 | #188 | Fair 3.0% |
Demographics Similar to Bolivians by Hearing Disability
In terms of hearing disability, the demographic groups most similar to Bolivians are Immigrants from Haiti (2.6%, a difference of 0.020%), Immigrants from Caribbean (2.6%, a difference of 0.080%), Immigrants from Cameroon (2.6%, a difference of 0.090%), Immigrants from Venezuela (2.6%, a difference of 0.23%), and Immigrants from South Central Asia (2.6%, a difference of 0.40%).
| Demographics | Rating | Rank | Hearing Disability |
| Immigrants | Sierra Leone | 99.8 /100 | #22 | Exceptional 2.6% |
| Immigrants | Nigeria | 99.8 /100 | #23 | Exceptional 2.6% |
| Immigrants | Ghana | 99.8 /100 | #24 | Exceptional 2.6% |
| Immigrants | El Salvador | 99.7 /100 | #25 | Exceptional 2.6% |
| Immigrants | Senegal | 99.7 /100 | #26 | Exceptional 2.6% |
| Immigrants | South Central Asia | 99.7 /100 | #27 | Exceptional 2.6% |
| Immigrants | Haiti | 99.7 /100 | #28 | Exceptional 2.6% |
| Bolivians | 99.7 /100 | #29 | Exceptional 2.6% |
| Immigrants | Caribbean | 99.7 /100 | #30 | Exceptional 2.6% |
| Immigrants | Cameroon | 99.7 /100 | #31 | Exceptional 2.6% |
| Immigrants | Venezuela | 99.7 /100 | #32 | Exceptional 2.6% |
| Filipinos | 99.6 /100 | #33 | Exceptional 2.6% |
| Immigrants | Pakistan | 99.6 /100 | #34 | Exceptional 2.6% |
| Salvadorans | 99.6 /100 | #35 | Exceptional 2.6% |
| Okinawans | 99.6 /100 | #36 | Exceptional 2.6% |