Immigrants from Bahamas vs Immigrants from France Disability Age 65 to 74
COMPARE
Immigrants from Bahamas
Immigrants from France
Disability Age 65 to 74
Disability Age 65 to 74 Comparison
Immigrants from Bahamas
Immigrants from France
23.7%
DISABILITY AGE 65 TO 74
23.3/ 100
METRIC RATING
202nd/ 347
METRIC RANK
21.5%
DISABILITY AGE 65 TO 74
99.6/ 100
METRIC RATING
52nd/ 347
METRIC RANK
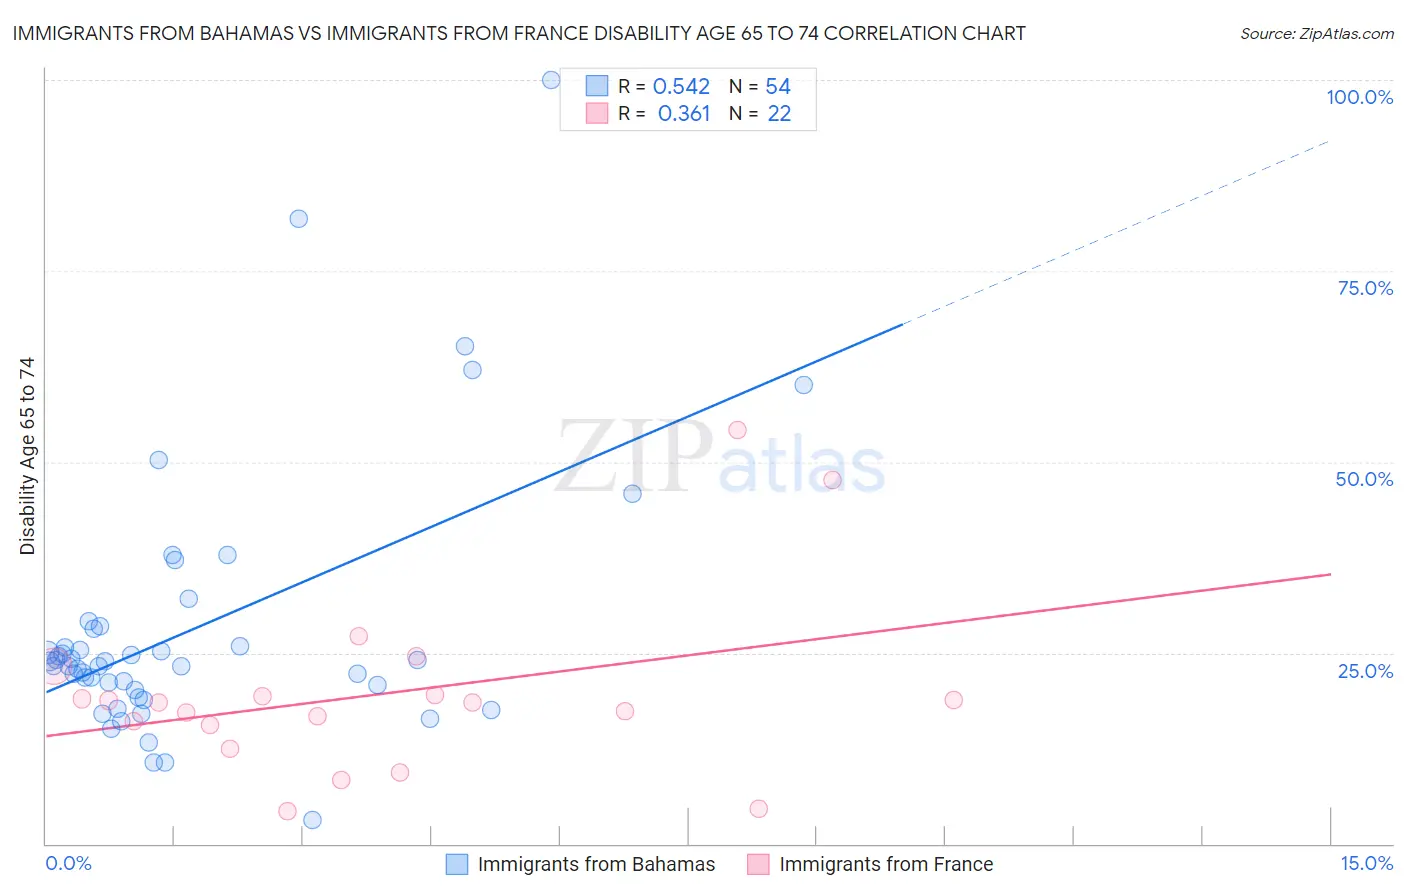
Immigrants from Bahamas vs Immigrants from France Disability Age 65 to 74 Correlation Chart
The statistical analysis conducted on geographies consisting of 104,578,963 people shows a substantial positive correlation between the proportion of Immigrants from Bahamas and percentage of population with a disability between the ages 65 and 75 in the United States with a correlation coefficient (R) of 0.542 and weighted average of 23.7%. Similarly, the statistical analysis conducted on geographies consisting of 287,648,161 people shows a mild positive correlation between the proportion of Immigrants from France and percentage of population with a disability between the ages 65 and 75 in the United States with a correlation coefficient (R) of 0.361 and weighted average of 21.5%, a difference of 10.5%.
Disability Age 65 to 74 Correlation Summary
| Measurement | Immigrants from Bahamas | Immigrants from France |
| Minimum | 3.1% | 4.3% |
| Maximum | 100.0% | 54.1% |
| Range | 96.9% | 49.8% |
| Mean | 28.1% | 19.6% |
| Median | 23.6% | 18.5% |
| Interquartile 25% (IQ1) | 20.1% | 15.6% |
| Interquartile 75% (IQ3) | 28.1% | 19.5% |
| Interquartile Range (IQR) | 7.9% | 3.9% |
| Standard Deviation (Sample) | 17.3% | 11.7% |
| Standard Deviation (Population) | 17.2% | 11.4% |
Similar Demographics by Disability Age 65 to 74
Demographics Similar to Immigrants from Bahamas by Disability Age 65 to 74
In terms of disability age 65 to 74, the demographic groups most similar to Immigrants from Bahamas are Kenyan (23.7%, a difference of 0.010%), Immigrants from Ecuador (23.7%, a difference of 0.040%), French Canadian (23.7%, a difference of 0.050%), Immigrants from Africa (23.7%, a difference of 0.080%), and Welsh (23.7%, a difference of 0.080%).
| Demographics | Rating | Rank | Disability Age 65 to 74 |
| Immigrants | St. Vincent and the Grenadines | 26.1 /100 | #195 | Fair 23.7% |
| Immigrants | Trinidad and Tobago | 26.1 /100 | #196 | Fair 23.7% |
| Immigrants | Immigrants | 25.8 /100 | #197 | Fair 23.7% |
| Immigrants | Africa | 24.4 /100 | #198 | Fair 23.7% |
| Welsh | 24.3 /100 | #199 | Fair 23.7% |
| French Canadians | 24.0 /100 | #200 | Fair 23.7% |
| Immigrants | Ecuador | 23.9 /100 | #201 | Fair 23.7% |
| Immigrants | Bahamas | 23.3 /100 | #202 | Fair 23.7% |
| Kenyans | 23.2 /100 | #203 | Fair 23.7% |
| Immigrants | Grenada | 22.1 /100 | #204 | Fair 23.8% |
| Tongans | 20.8 /100 | #205 | Fair 23.8% |
| Immigrants | Jamaica | 20.7 /100 | #206 | Fair 23.8% |
| Immigrants | Sudan | 20.1 /100 | #207 | Fair 23.8% |
| Immigrants | Barbados | 19.6 /100 | #208 | Poor 23.8% |
| Immigrants | Kenya | 19.6 /100 | #209 | Poor 23.8% |
Demographics Similar to Immigrants from France by Disability Age 65 to 74
In terms of disability age 65 to 74, the demographic groups most similar to Immigrants from France are Bhutanese (21.5%, a difference of 0.010%), Immigrants from Italy (21.5%, a difference of 0.020%), Immigrants from Romania (21.5%, a difference of 0.090%), Immigrants from Denmark (21.5%, a difference of 0.11%), and Immigrants from Asia (21.5%, a difference of 0.21%).
| Demographics | Rating | Rank | Disability Age 65 to 74 |
| Asians | 99.7 /100 | #45 | Exceptional 21.4% |
| Immigrants | Turkey | 99.7 /100 | #46 | Exceptional 21.4% |
| Immigrants | Bulgaria | 99.7 /100 | #47 | Exceptional 21.4% |
| Lithuanians | 99.7 /100 | #48 | Exceptional 21.4% |
| Luxembourgers | 99.7 /100 | #49 | Exceptional 21.4% |
| Immigrants | Malaysia | 99.7 /100 | #50 | Exceptional 21.4% |
| Immigrants | Serbia | 99.6 /100 | #51 | Exceptional 21.4% |
| Immigrants | France | 99.6 /100 | #52 | Exceptional 21.5% |
| Bhutanese | 99.6 /100 | #53 | Exceptional 21.5% |
| Immigrants | Italy | 99.6 /100 | #54 | Exceptional 21.5% |
| Immigrants | Romania | 99.5 /100 | #55 | Exceptional 21.5% |
| Immigrants | Denmark | 99.5 /100 | #56 | Exceptional 21.5% |
| Immigrants | Asia | 99.5 /100 | #57 | Exceptional 21.5% |
| Immigrants | Pakistan | 99.5 /100 | #58 | Exceptional 21.5% |
| Zimbabweans | 99.5 /100 | #59 | Exceptional 21.5% |