Immigrants from Bahamas vs Cuban Disability Age 65 to 74
COMPARE
Immigrants from Bahamas
Cuban
Disability Age 65 to 74
Disability Age 65 to 74 Comparison
Immigrants from Bahamas
Cubans
23.7%
DISABILITY AGE 65 TO 74
23.3/ 100
METRIC RATING
202nd/ 347
METRIC RANK
23.3%
DISABILITY AGE 65 TO 74
51.9/ 100
METRIC RATING
171st/ 347
METRIC RANK
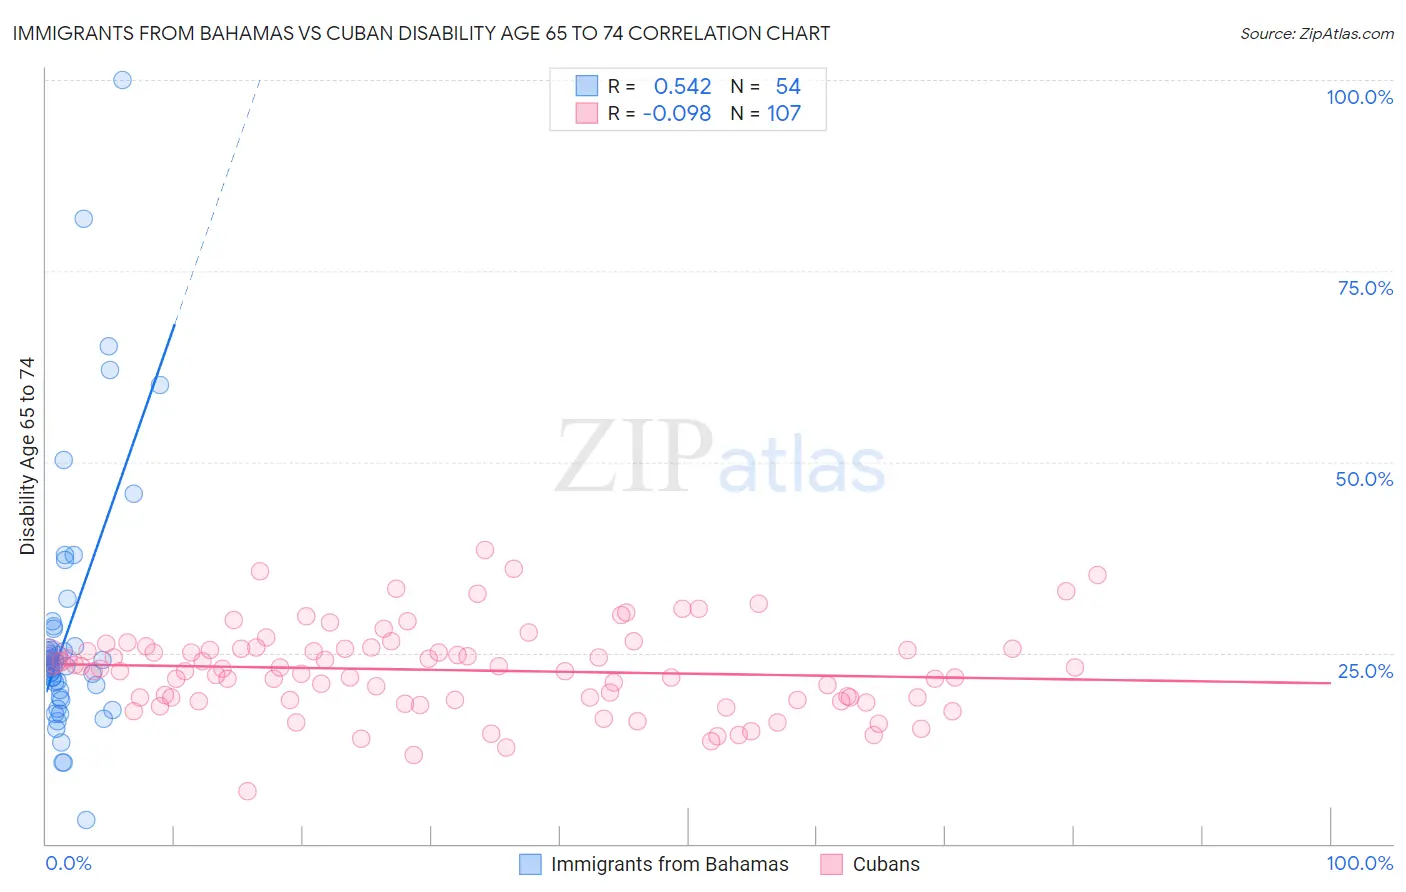
Immigrants from Bahamas vs Cuban Disability Age 65 to 74 Correlation Chart
The statistical analysis conducted on geographies consisting of 104,578,963 people shows a substantial positive correlation between the proportion of Immigrants from Bahamas and percentage of population with a disability between the ages 65 and 75 in the United States with a correlation coefficient (R) of 0.542 and weighted average of 23.7%. Similarly, the statistical analysis conducted on geographies consisting of 448,265,538 people shows a slight negative correlation between the proportion of Cubans and percentage of population with a disability between the ages 65 and 75 in the United States with a correlation coefficient (R) of -0.098 and weighted average of 23.3%, a difference of 1.8%.
Disability Age 65 to 74 Correlation Summary
| Measurement | Immigrants from Bahamas | Cuban |
| Minimum | 3.1% | 6.9% |
| Maximum | 100.0% | 38.5% |
| Range | 96.9% | 31.6% |
| Mean | 28.1% | 22.7% |
| Median | 23.6% | 22.9% |
| Interquartile 25% (IQ1) | 20.1% | 18.9% |
| Interquartile 75% (IQ3) | 28.1% | 25.6% |
| Interquartile Range (IQR) | 7.9% | 6.7% |
| Standard Deviation (Sample) | 17.3% | 5.7% |
| Standard Deviation (Population) | 17.2% | 5.7% |
Similar Demographics by Disability Age 65 to 74
Demographics Similar to Immigrants from Bahamas by Disability Age 65 to 74
In terms of disability age 65 to 74, the demographic groups most similar to Immigrants from Bahamas are Kenyan (23.7%, a difference of 0.010%), Immigrants from Ecuador (23.7%, a difference of 0.040%), French Canadian (23.7%, a difference of 0.050%), Immigrants from Africa (23.7%, a difference of 0.080%), and Welsh (23.7%, a difference of 0.080%).
| Demographics | Rating | Rank | Disability Age 65 to 74 |
| Immigrants | St. Vincent and the Grenadines | 26.1 /100 | #195 | Fair 23.7% |
| Immigrants | Trinidad and Tobago | 26.1 /100 | #196 | Fair 23.7% |
| Immigrants | Immigrants | 25.8 /100 | #197 | Fair 23.7% |
| Immigrants | Africa | 24.4 /100 | #198 | Fair 23.7% |
| Welsh | 24.3 /100 | #199 | Fair 23.7% |
| French Canadians | 24.0 /100 | #200 | Fair 23.7% |
| Immigrants | Ecuador | 23.9 /100 | #201 | Fair 23.7% |
| Immigrants | Bahamas | 23.3 /100 | #202 | Fair 23.7% |
| Kenyans | 23.2 /100 | #203 | Fair 23.7% |
| Immigrants | Grenada | 22.1 /100 | #204 | Fair 23.8% |
| Tongans | 20.8 /100 | #205 | Fair 23.8% |
| Immigrants | Jamaica | 20.7 /100 | #206 | Fair 23.8% |
| Immigrants | Sudan | 20.1 /100 | #207 | Fair 23.8% |
| Immigrants | Barbados | 19.6 /100 | #208 | Poor 23.8% |
| Immigrants | Kenya | 19.6 /100 | #209 | Poor 23.8% |
Demographics Similar to Cubans by Disability Age 65 to 74
In terms of disability age 65 to 74, the demographic groups most similar to Cubans are German (23.3%, a difference of 0.080%), Yugoslavian (23.3%, a difference of 0.10%), Immigrants from South Eastern Asia (23.3%, a difference of 0.11%), Moroccan (23.3%, a difference of 0.13%), and Icelander (23.3%, a difference of 0.14%).
| Demographics | Rating | Rank | Disability Age 65 to 74 |
| Sierra Leoneans | 60.9 /100 | #164 | Good 23.2% |
| Vietnamese | 60.8 /100 | #165 | Good 23.2% |
| Immigrants | Afghanistan | 60.5 /100 | #166 | Good 23.2% |
| Immigrants | Bosnia and Herzegovina | 57.6 /100 | #167 | Average 23.2% |
| Pakistanis | 57.0 /100 | #168 | Average 23.2% |
| Icelanders | 54.3 /100 | #169 | Average 23.3% |
| Moroccans | 54.2 /100 | #170 | Average 23.3% |
| Cubans | 51.9 /100 | #171 | Average 23.3% |
| Germans | 50.5 /100 | #172 | Average 23.3% |
| Yugoslavians | 50.2 /100 | #173 | Average 23.3% |
| Immigrants | South Eastern Asia | 50.0 /100 | #174 | Average 23.3% |
| Dutch | 49.4 /100 | #175 | Average 23.3% |
| Immigrants | Eritrea | 47.5 /100 | #176 | Average 23.4% |
| Immigrants | Haiti | 47.5 /100 | #177 | Average 23.4% |
| Guyanese | 45.8 /100 | #178 | Average 23.4% |