Immigrants from the Azores vs South American Disability Age 65 to 74
COMPARE
Immigrants from the Azores
South American
Disability Age 65 to 74
Disability Age 65 to 74 Comparison
Immigrants from the Azores
South Americans
26.0%
DISABILITY AGE 65 TO 74
0.0/ 100
METRIC RATING
284th/ 347
METRIC RANK
22.2%
DISABILITY AGE 65 TO 74
96.4/ 100
METRIC RATING
103rd/ 347
METRIC RANK
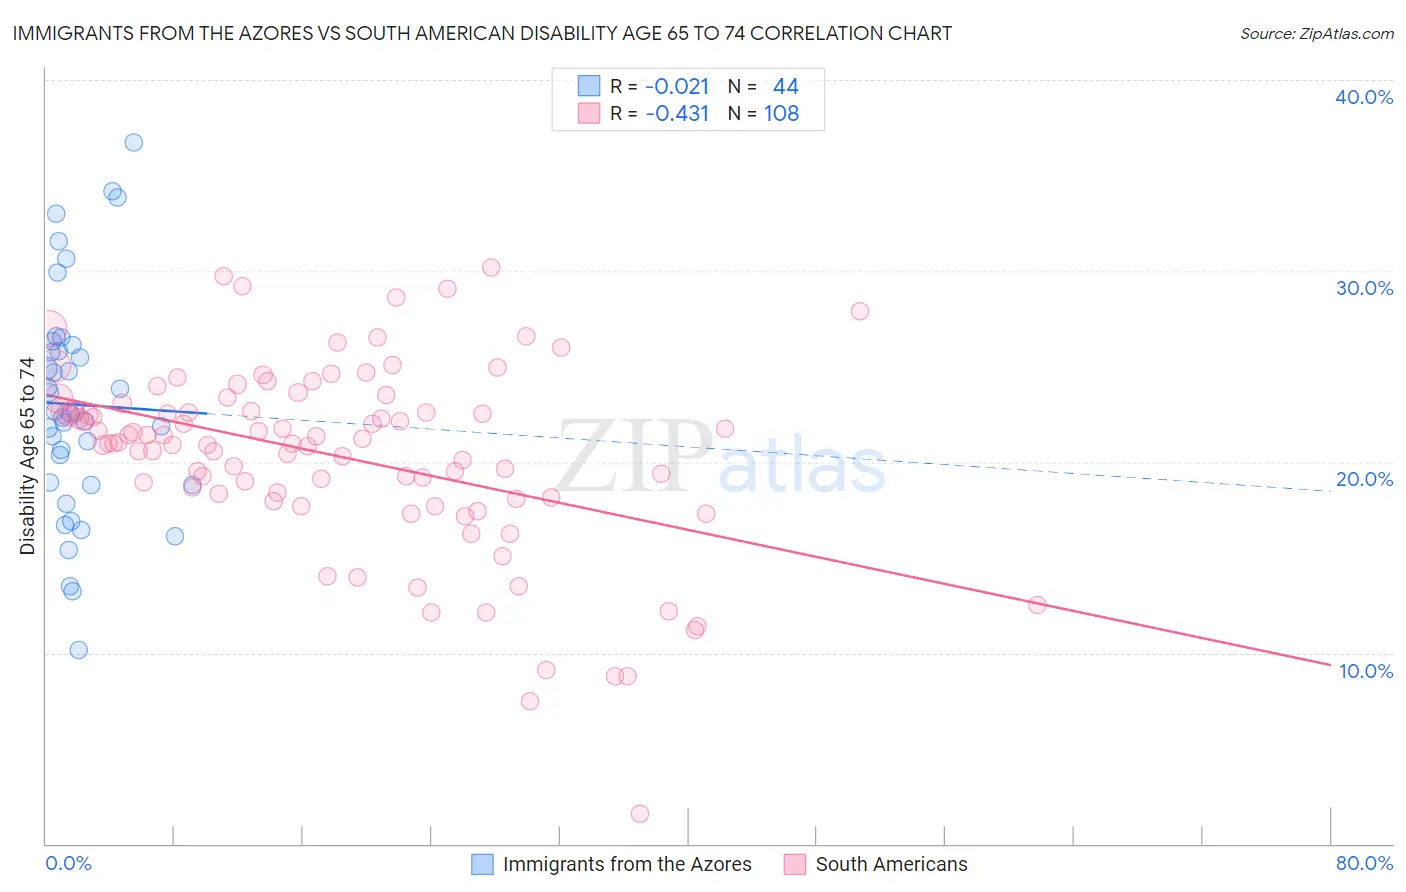
Immigrants from the Azores vs South American Disability Age 65 to 74 Correlation Chart
The statistical analysis conducted on geographies consisting of 46,238,096 people shows no correlation between the proportion of Immigrants from the Azores and percentage of population with a disability between the ages 65 and 75 in the United States with a correlation coefficient (R) of -0.021 and weighted average of 26.0%. Similarly, the statistical analysis conducted on geographies consisting of 492,506,151 people shows a moderate negative correlation between the proportion of South Americans and percentage of population with a disability between the ages 65 and 75 in the United States with a correlation coefficient (R) of -0.431 and weighted average of 22.2%, a difference of 17.0%.
Disability Age 65 to 74 Correlation Summary
| Measurement | Immigrants from the Azores | South American |
| Minimum | 10.1% | 1.6% |
| Maximum | 36.7% | 30.2% |
| Range | 26.6% | 28.6% |
| Mean | 23.0% | 20.3% |
| Median | 22.6% | 21.0% |
| Interquartile 25% (IQ1) | 18.9% | 18.2% |
| Interquartile 75% (IQ3) | 25.9% | 22.9% |
| Interquartile Range (IQR) | 7.1% | 4.6% |
| Standard Deviation (Sample) | 5.8% | 5.0% |
| Standard Deviation (Population) | 5.8% | 5.0% |
Similar Demographics by Disability Age 65 to 74
Demographics Similar to Immigrants from the Azores by Disability Age 65 to 74
In terms of disability age 65 to 74, the demographic groups most similar to Immigrants from the Azores are Immigrants from Congo (26.0%, a difference of 0.020%), Spanish American (25.9%, a difference of 0.19%), Delaware (25.9%, a difference of 0.33%), Immigrants from Honduras (25.9%, a difference of 0.40%), and Cree (25.9%, a difference of 0.42%).
| Demographics | Rating | Rank | Disability Age 65 to 74 |
| Belizeans | 0.1 /100 | #277 | Tragic 25.8% |
| Immigrants | Belize | 0.1 /100 | #278 | Tragic 25.8% |
| U.S. Virgin Islanders | 0.1 /100 | #279 | Tragic 25.9% |
| Cree | 0.1 /100 | #280 | Tragic 25.9% |
| Immigrants | Honduras | 0.1 /100 | #281 | Tragic 25.9% |
| Delaware | 0.1 /100 | #282 | Tragic 25.9% |
| Spanish Americans | 0.0 /100 | #283 | Tragic 25.9% |
| Immigrants | Azores | 0.0 /100 | #284 | Tragic 26.0% |
| Immigrants | Congo | 0.0 /100 | #285 | Tragic 26.0% |
| Immigrants | Micronesia | 0.0 /100 | #286 | Tragic 26.1% |
| Immigrants | Laos | 0.0 /100 | #287 | Tragic 26.1% |
| Mexican American Indians | 0.0 /100 | #288 | Tragic 26.2% |
| Africans | 0.0 /100 | #289 | Tragic 26.2% |
| Immigrants | Cabo Verde | 0.0 /100 | #290 | Tragic 26.3% |
| Spanish American Indians | 0.0 /100 | #291 | Tragic 26.4% |
Demographics Similar to South Americans by Disability Age 65 to 74
In terms of disability age 65 to 74, the demographic groups most similar to South Americans are Colombian (22.2%, a difference of 0.010%), Immigrants from Saudi Arabia (22.2%, a difference of 0.020%), Immigrants from England (22.2%, a difference of 0.050%), Palestinian (22.2%, a difference of 0.050%), and Uruguayan (22.2%, a difference of 0.060%).
| Demographics | Rating | Rank | Disability Age 65 to 74 |
| Immigrants | North America | 97.5 /100 | #96 | Exceptional 22.1% |
| Immigrants | Southern Europe | 97.2 /100 | #97 | Exceptional 22.1% |
| Jordanians | 96.9 /100 | #98 | Exceptional 22.2% |
| Immigrants | Colombia | 96.8 /100 | #99 | Exceptional 22.2% |
| Uruguayans | 96.5 /100 | #100 | Exceptional 22.2% |
| Immigrants | England | 96.5 /100 | #101 | Exceptional 22.2% |
| Immigrants | Saudi Arabia | 96.4 /100 | #102 | Exceptional 22.2% |
| South Americans | 96.4 /100 | #103 | Exceptional 22.2% |
| Colombians | 96.4 /100 | #104 | Exceptional 22.2% |
| Palestinians | 96.3 /100 | #105 | Exceptional 22.2% |
| Peruvians | 96.1 /100 | #106 | Exceptional 22.2% |
| Slovenes | 96.1 /100 | #107 | Exceptional 22.2% |
| Immigrants | Zimbabwe | 96.1 /100 | #108 | Exceptional 22.3% |
| Albanians | 95.8 /100 | #109 | Exceptional 22.3% |
| Immigrants | Peru | 95.7 /100 | #110 | Exceptional 22.3% |