Croatian vs South American Disability Age 65 to 74
COMPARE
Croatian
South American
Disability Age 65 to 74
Disability Age 65 to 74 Comparison
Croatians
South Americans
21.8%
DISABILITY AGE 65 TO 74
98.9/ 100
METRIC RATING
81st/ 347
METRIC RANK
22.2%
DISABILITY AGE 65 TO 74
96.4/ 100
METRIC RATING
103rd/ 347
METRIC RANK
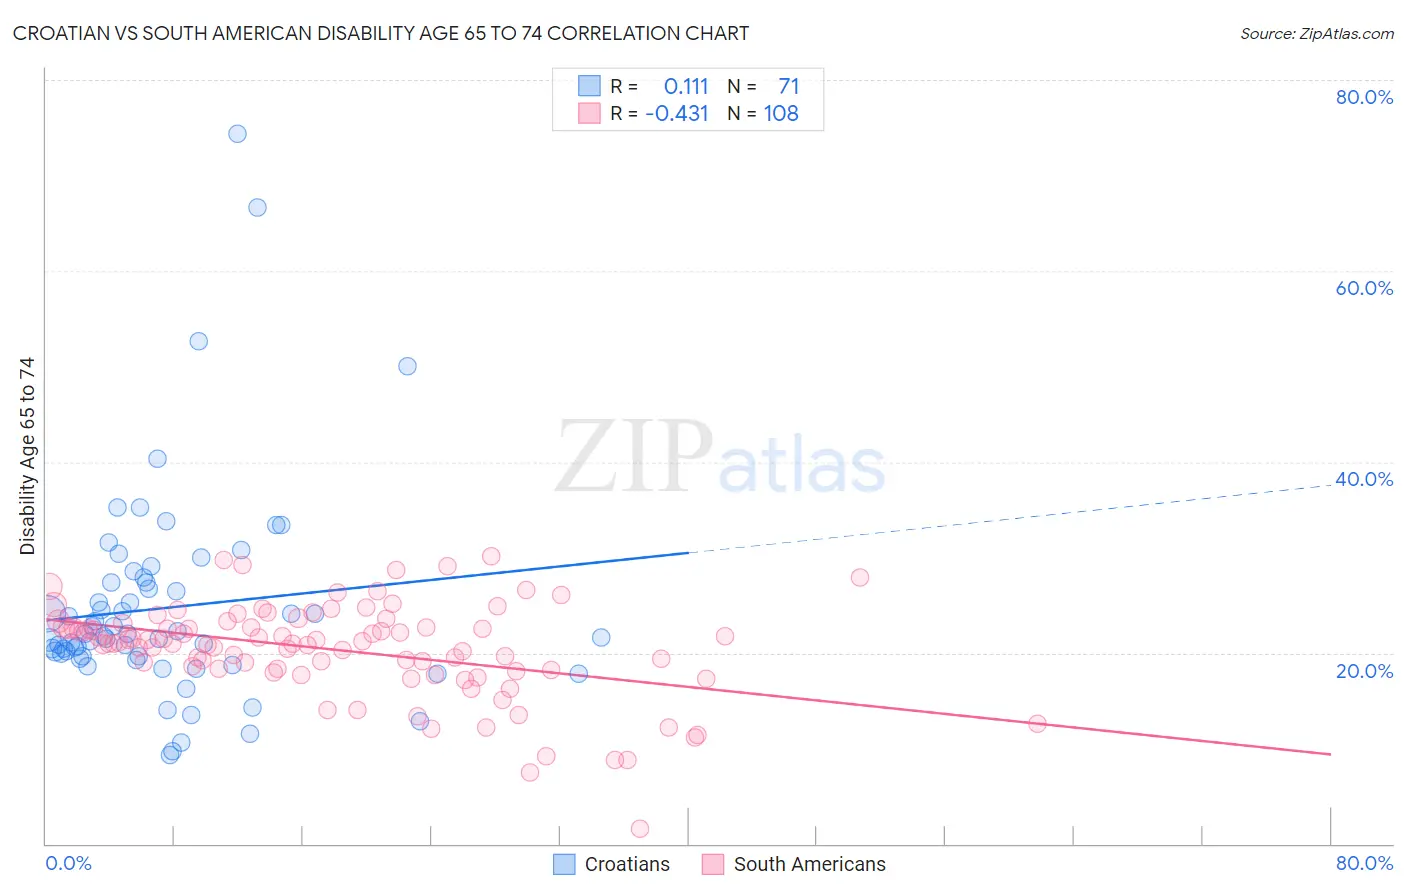
Croatian vs South American Disability Age 65 to 74 Correlation Chart
The statistical analysis conducted on geographies consisting of 375,202,419 people shows a poor positive correlation between the proportion of Croatians and percentage of population with a disability between the ages 65 and 75 in the United States with a correlation coefficient (R) of 0.111 and weighted average of 21.8%. Similarly, the statistical analysis conducted on geographies consisting of 492,506,151 people shows a moderate negative correlation between the proportion of South Americans and percentage of population with a disability between the ages 65 and 75 in the United States with a correlation coefficient (R) of -0.431 and weighted average of 22.2%, a difference of 1.9%.
Disability Age 65 to 74 Correlation Summary
| Measurement | Croatian | South American |
| Minimum | 9.4% | 1.6% |
| Maximum | 74.4% | 30.2% |
| Range | 65.1% | 28.6% |
| Mean | 24.7% | 20.3% |
| Median | 21.8% | 21.0% |
| Interquartile 25% (IQ1) | 19.6% | 18.2% |
| Interquartile 75% (IQ3) | 27.4% | 22.9% |
| Interquartile Range (IQR) | 7.8% | 4.6% |
| Standard Deviation (Sample) | 11.1% | 5.0% |
| Standard Deviation (Population) | 11.0% | 5.0% |
Similar Demographics by Disability Age 65 to 74
Demographics Similar to Croatians by Disability Age 65 to 74
In terms of disability age 65 to 74, the demographic groups most similar to Croatians are Immigrants from Norway (21.8%, a difference of 0.070%), Immigrants from Eastern Europe (21.8%, a difference of 0.080%), Venezuelan (21.8%, a difference of 0.080%), Immigrants from Poland (21.8%, a difference of 0.14%), and Greek (21.8%, a difference of 0.20%).
| Demographics | Rating | Rank | Disability Age 65 to 74 |
| Cambodians | 99.0 /100 | #74 | Exceptional 21.8% |
| Mongolians | 99.0 /100 | #75 | Exceptional 21.8% |
| Greeks | 99.0 /100 | #76 | Exceptional 21.8% |
| Immigrants | Poland | 99.0 /100 | #77 | Exceptional 21.8% |
| Immigrants | Eastern Europe | 99.0 /100 | #78 | Exceptional 21.8% |
| Venezuelans | 99.0 /100 | #79 | Exceptional 21.8% |
| Immigrants | Norway | 98.9 /100 | #80 | Exceptional 21.8% |
| Croatians | 98.9 /100 | #81 | Exceptional 21.8% |
| Immigrants | Indonesia | 98.7 /100 | #82 | Exceptional 21.9% |
| Immigrants | Brazil | 98.5 /100 | #83 | Exceptional 21.9% |
| Immigrants | Spain | 98.5 /100 | #84 | Exceptional 21.9% |
| Immigrants | Lebanon | 98.4 /100 | #85 | Exceptional 21.9% |
| South Africans | 98.4 /100 | #86 | Exceptional 21.9% |
| Australians | 98.0 /100 | #87 | Exceptional 22.0% |
| Immigrants | Netherlands | 97.9 /100 | #88 | Exceptional 22.0% |
Demographics Similar to South Americans by Disability Age 65 to 74
In terms of disability age 65 to 74, the demographic groups most similar to South Americans are Colombian (22.2%, a difference of 0.010%), Immigrants from Saudi Arabia (22.2%, a difference of 0.020%), Immigrants from England (22.2%, a difference of 0.050%), Palestinian (22.2%, a difference of 0.050%), and Uruguayan (22.2%, a difference of 0.060%).
| Demographics | Rating | Rank | Disability Age 65 to 74 |
| Immigrants | North America | 97.5 /100 | #96 | Exceptional 22.1% |
| Immigrants | Southern Europe | 97.2 /100 | #97 | Exceptional 22.1% |
| Jordanians | 96.9 /100 | #98 | Exceptional 22.2% |
| Immigrants | Colombia | 96.8 /100 | #99 | Exceptional 22.2% |
| Uruguayans | 96.5 /100 | #100 | Exceptional 22.2% |
| Immigrants | England | 96.5 /100 | #101 | Exceptional 22.2% |
| Immigrants | Saudi Arabia | 96.4 /100 | #102 | Exceptional 22.2% |
| South Americans | 96.4 /100 | #103 | Exceptional 22.2% |
| Colombians | 96.4 /100 | #104 | Exceptional 22.2% |
| Palestinians | 96.3 /100 | #105 | Exceptional 22.2% |
| Peruvians | 96.1 /100 | #106 | Exceptional 22.2% |
| Slovenes | 96.1 /100 | #107 | Exceptional 22.2% |
| Immigrants | Zimbabwe | 96.1 /100 | #108 | Exceptional 22.3% |
| Albanians | 95.8 /100 | #109 | Exceptional 22.3% |
| Immigrants | Peru | 95.7 /100 | #110 | Exceptional 22.3% |