Immigrants from Australia vs Immigrants from Caribbean Disability
COMPARE
Immigrants from Australia
Immigrants from Caribbean
Disability
Disability Comparison
Immigrants from Australia
Immigrants from Caribbean
10.8%
DISABILITY
99.9/ 100
METRIC RATING
41st/ 347
METRIC RANK
12.0%
DISABILITY
9.1/ 100
METRIC RATING
208th/ 347
METRIC RANK
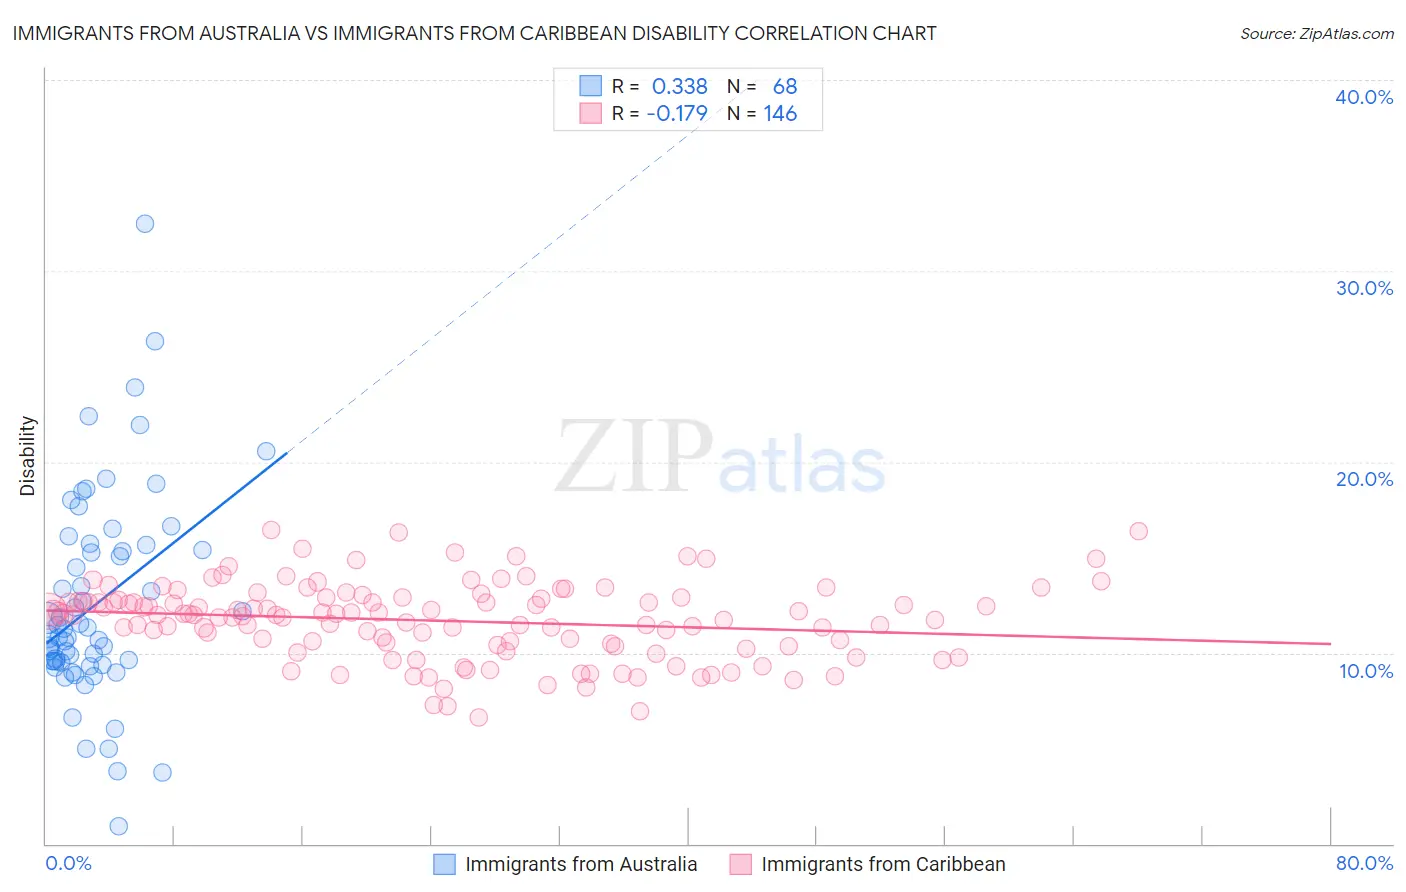
Immigrants from Australia vs Immigrants from Caribbean Disability Correlation Chart
The statistical analysis conducted on geographies consisting of 227,205,493 people shows a mild positive correlation between the proportion of Immigrants from Australia and percentage of population with a disability in the United States with a correlation coefficient (R) of 0.338 and weighted average of 10.8%. Similarly, the statistical analysis conducted on geographies consisting of 449,955,914 people shows a poor negative correlation between the proportion of Immigrants from Caribbean and percentage of population with a disability in the United States with a correlation coefficient (R) of -0.179 and weighted average of 12.0%, a difference of 11.4%.
Disability Correlation Summary
| Measurement | Immigrants from Australia | Immigrants from Caribbean |
| Minimum | 0.92% | 6.6% |
| Maximum | 32.5% | 16.5% |
| Range | 31.6% | 9.9% |
| Mean | 12.6% | 11.7% |
| Median | 11.1% | 12.0% |
| Interquartile 25% (IQ1) | 9.5% | 10.4% |
| Interquartile 75% (IQ3) | 15.5% | 12.8% |
| Interquartile Range (IQR) | 6.0% | 2.5% |
| Standard Deviation (Sample) | 5.5% | 2.0% |
| Standard Deviation (Population) | 5.4% | 2.0% |
Similar Demographics by Disability
Demographics Similar to Immigrants from Australia by Disability
In terms of disability, the demographic groups most similar to Immigrants from Australia are Cambodian (10.8%, a difference of 0.040%), Mongolian (10.8%, a difference of 0.040%), Immigrants from Nepal (10.8%, a difference of 0.10%), Afghan (10.8%, a difference of 0.15%), and Israeli (10.8%, a difference of 0.15%).
| Demographics | Rating | Rank | Disability |
| Immigrants | Ethiopia | 100.0 /100 | #34 | Exceptional 10.7% |
| Immigrants | Indonesia | 100.0 /100 | #35 | Exceptional 10.7% |
| Ethiopians | 100.0 /100 | #36 | Exceptional 10.7% |
| Turks | 100.0 /100 | #37 | Exceptional 10.7% |
| Afghans | 99.9 /100 | #38 | Exceptional 10.8% |
| Cambodians | 99.9 /100 | #39 | Exceptional 10.8% |
| Mongolians | 99.9 /100 | #40 | Exceptional 10.8% |
| Immigrants | Australia | 99.9 /100 | #41 | Exceptional 10.8% |
| Immigrants | Nepal | 99.9 /100 | #42 | Exceptional 10.8% |
| Israelis | 99.9 /100 | #43 | Exceptional 10.8% |
| Immigrants | Japan | 99.9 /100 | #44 | Exceptional 10.8% |
| Immigrants | Peru | 99.9 /100 | #45 | Exceptional 10.8% |
| Tongans | 99.9 /100 | #46 | Exceptional 10.8% |
| Taiwanese | 99.9 /100 | #47 | Exceptional 10.8% |
| Soviet Union | 99.9 /100 | #48 | Exceptional 10.9% |
Demographics Similar to Immigrants from Caribbean by Disability
In terms of disability, the demographic groups most similar to Immigrants from Caribbean are Immigrants from Thailand (12.0%, a difference of 0.020%), Immigrants from Senegal (12.0%, a difference of 0.040%), Danish (12.0%, a difference of 0.050%), Immigrants from Western Europe (12.0%, a difference of 0.12%), and Czech (12.0%, a difference of 0.17%).
| Demographics | Rating | Rank | Disability |
| Assyrians/Chaldeans/Syriacs | 12.6 /100 | #201 | Poor 11.9% |
| Immigrants | England | 12.0 /100 | #202 | Poor 12.0% |
| British West Indians | 11.5 /100 | #203 | Poor 12.0% |
| Mexican American Indians | 11.4 /100 | #204 | Poor 12.0% |
| Immigrants | Western Europe | 10.1 /100 | #205 | Poor 12.0% |
| Immigrants | Senegal | 9.4 /100 | #206 | Tragic 12.0% |
| Immigrants | Thailand | 9.3 /100 | #207 | Tragic 12.0% |
| Immigrants | Caribbean | 9.1 /100 | #208 | Tragic 12.0% |
| Danes | 8.7 /100 | #209 | Tragic 12.0% |
| Czechs | 7.9 /100 | #210 | Tragic 12.0% |
| Immigrants | Cambodia | 7.3 /100 | #211 | Tragic 12.0% |
| Austrians | 7.2 /100 | #212 | Tragic 12.0% |
| Immigrants | Iraq | 7.1 /100 | #213 | Tragic 12.0% |
| Immigrants | Somalia | 6.8 /100 | #214 | Tragic 12.0% |
| Immigrants | Canada | 6.1 /100 | #215 | Tragic 12.1% |