Hungarian vs Immigrants from Somalia Vision Disability

COMPARE

Hungarian
Race
Ancestry
AfghanAfricanAlaska NativeAlaskan AthabascanAlbanianAleutAlsatianAmericanApacheArabArapahoArgentineanArmenianAssyrian/Chaldean/SyriacAustralianAustrianBahamianBangladeshiBarbadianBasqueBelgianBelizeanBermudanBhutaneseBlackfeetBolivianBrazilianBritishBritish West IndianBulgarianBurmeseCajunCambodianCanadianCape VerdeanCarpatho RusynCelticCentral AmericanCentral American IndianCherokeeCheyenneChickasawChileanChineseChippewaChoctawColombianColvilleComancheCosta RicanCreeCreekCroatianCrowCubanCypriotCzechCzechoslovakianDanishDelawareDominicanDutchDutch West IndianEastern EuropeanEcuadorianEgyptianEnglishEstonianEthiopianEuropeanFijianFilipinoFinnishFrenchFrench American IndianFrench CanadianGermanGerman RussianGhanaianGreekGuamanian/ChamorroGuatemalanGuyaneseHaitianHmongHonduranHopiHoumaHungarianIcelanderIndian (Asian)IndonesianInupiatIranianIraqiIrishIroquoisIsraeliItalianJamaicanJapaneseJordanianKenyanKiowaKoreanLaotianLatvianLebaneseLiberianLithuanianLumbeeLuxembourgerMacedonianMalaysianMalteseMarshalleseMenomineeMexicanMexican American IndianMongolianMoroccanNative HawaiianNavajoNepaleseNew ZealanderNicaraguanNigerianNorthern EuropeanNorwegianOkinawanOsageOttawaPaiutePakistaniPalestinianPanamanianParaguayanPennsylvania GermanPeruvianPimaPolishPortuguesePotawatomiPuebloPuerto RicanPuget Sound SalishRomanianRussianSalvadoranSamoanScandinavianScotch-IrishScottishSeminoleSenegaleseSerbianShoshoneSierra LeoneanSiouxSlavicSlovakSloveneSomaliSouth AfricanSouth AmericanSouth American IndianSoviet UnionSpaniardSpanishSpanish AmericanSpanish American IndianSri LankanSubsaharan AfricanSudaneseSwedishSwissSyrianTaiwaneseThaiTlingit-HaidaTohono O'OdhamTonganTrinidadian and TobagonianTsimshianTurkishU.S. Virgin IslanderUgandanUkrainianUruguayanUteVenezuelanVietnameseWelshWest IndianYakamaYaquiYugoslavianYumanYup'ikZimbabwean
Immigration
NonimmigrantsImmigrantsAfghanistanAfricaAlbaniaArgentinaArmeniaAsiaAustraliaAustriaBahamasBangladeshBarbadosBelarusBelgiumBelizeBoliviaBosnia and HerzegovinaBrazilBulgariaBurma/MyanmarCabo VerdeCambodiaCameroonCanadaCaribbeanCentral AmericaChileChinaColombiaCongoCosta RicaCroatiaCubaCzechoslovakiaDenmarkDominicaDominican RepublicEastern AfricaEastern AsiaEastern EuropeEcuadorEgyptEl SalvadorEnglandEritreaEthiopiaEuropeFijiFranceGermanyGhanaGreeceGrenadaGuatemalaGuyanaHaitiHondurasHong KongHungaryIndiaIndonesiaIranIraqIrelandIsraelItalyJamaicaJapanJordanKazakhstanKenyaKoreaKuwaitLaosLatin AmericaLatviaLebanonLiberiaLithuaniaMalaysiaMexicoMicronesiaMiddle AfricaMoldovaMoroccoNepalNetherlandsNicaraguaNigeriaNorth AmericaNorth MacedoniaNorthern AfricaNorthern EuropeNorwayOceaniaPakistanPanamaPeruPhilippinesPolandPortugalRomaniaRussiaSaudi ArabiaScotlandSenegalSerbiaSierra LeoneSingaporeSouth AfricaSouth AmericaSouth Central AsiaSouth Eastern AsiaSouthern EuropeSpainSri LankaSt. Vincent and the GrenadinesSudanSwedenSwitzerlandSyriaTaiwanThailandTrinidad and TobagoTurkeyUgandaUkraineUruguayUzbekistanVenezuelaVietnamWest IndiesWestern AfricaWestern AsiaWestern EuropeYemenZaireZimbabweAzores
Immigrants from Somalia
Race
Ancestry
AfghanAfricanAlaska NativeAlaskan AthabascanAlbanianAleutAlsatianAmericanApacheArabArapahoArgentineanArmenianAssyrian/Chaldean/SyriacAustralianAustrianBahamianBangladeshiBarbadianBasqueBelgianBelizeanBermudanBhutaneseBlackfeetBolivianBrazilianBritishBritish West IndianBulgarianBurmeseCajunCambodianCanadianCape VerdeanCarpatho RusynCelticCentral AmericanCentral American IndianCherokeeCheyenneChickasawChileanChineseChippewaChoctawColombianColvilleComancheCosta RicanCreeCreekCroatianCrowCubanCypriotCzechCzechoslovakianDanishDelawareDominicanDutchDutch West IndianEastern EuropeanEcuadorianEgyptianEnglishEstonianEthiopianEuropeanFijianFilipinoFinnishFrenchFrench American IndianFrench CanadianGermanGerman RussianGhanaianGreekGuamanian/ChamorroGuatemalanGuyaneseHaitianHmongHonduranHopiHoumaIcelanderIndian (Asian)IndonesianInupiatIranianIraqiIrishIroquoisIsraeliItalianJamaicanJapaneseJordanianKenyanKiowaKoreanLaotianLatvianLebaneseLiberianLithuanianLumbeeLuxembourgerMacedonianMalaysianMalteseMarshalleseMenomineeMexicanMexican American IndianMongolianMoroccanNative HawaiianNavajoNepaleseNew ZealanderNicaraguanNigerianNorthern EuropeanNorwegianOkinawanOsageOttawaPaiutePakistaniPalestinianPanamanianParaguayanPennsylvania GermanPeruvianPimaPolishPortuguesePotawatomiPuebloPuerto RicanPuget Sound SalishRomanianRussianSalvadoranSamoanScandinavianScotch-IrishScottishSeminoleSenegaleseSerbianShoshoneSierra LeoneanSiouxSlavicSlovakSloveneSomaliSouth AfricanSouth AmericanSouth American IndianSoviet UnionSpaniardSpanishSpanish AmericanSpanish American IndianSri LankanSubsaharan AfricanSudaneseSwedishSwissSyrianTaiwaneseThaiTlingit-HaidaTohono O'OdhamTonganTrinidadian and TobagonianTsimshianTurkishU.S. Virgin IslanderUgandanUkrainianUruguayanUteVenezuelanVietnameseWelshWest IndianYakamaYaquiYugoslavianYumanYup'ikZimbabwean
Immigration
NonimmigrantsImmigrantsAfghanistanAfricaAlbaniaArgentinaArmeniaAsiaAustraliaAustriaBahamasBangladeshBarbadosBelarusBelgiumBelizeBoliviaBosnia and HerzegovinaBrazilBulgariaBurma/MyanmarCabo VerdeCambodiaCameroonCanadaCaribbeanCentral AmericaChileChinaColombiaCongoCosta RicaCroatiaCubaCzechoslovakiaDenmarkDominicaDominican RepublicEastern AfricaEastern AsiaEastern EuropeEcuadorEgyptEl SalvadorEnglandEritreaEthiopiaEuropeFijiFranceGermanyGhanaGreeceGrenadaGuatemalaGuyanaHaitiHondurasHong KongHungaryIndiaIndonesiaIranIraqIrelandIsraelItalyJamaicaJapanJordanKazakhstanKenyaKoreaKuwaitLaosLatin AmericaLatviaLebanonLiberiaLithuaniaMalaysiaMexicoMicronesiaMiddle AfricaMoldovaMoroccoNepalNetherlandsNicaraguaNigeriaNorth AmericaNorth MacedoniaNorthern AfricaNorthern EuropeNorwayOceaniaPakistanPanamaPeruPhilippinesPolandPortugalRomaniaRussiaSaudi ArabiaScotlandSenegalSerbiaSierra LeoneSingaporeSomaliaSouth AfricaSouth AmericaSouth Central AsiaSouth Eastern AsiaSouthern EuropeSpainSri LankaSt. Vincent and the GrenadinesSudanSwedenSwitzerlandSyriaTaiwanThailandTrinidad and TobagoTurkeyUgandaUkraineUruguayUzbekistanVenezuelaVietnamWest IndiesWestern AfricaWestern AsiaWestern EuropeYemenZaireZimbabweAzores
Vision Disability
Income
Poverty
Unemployment
Labor Participation
Family Structure
Vehicle Availability
Education Level
Disability

Vision Disability Comparison

Hungarians

Immigrants from Somalia

Good
Exceptional
2.1%
VISION DISABILITY
67.4/ 100
METRIC RATING
162nd/ 347
METRIC RANK
2.1%
VISION DISABILITY
96.2/ 100
METRIC RATING
91st/ 347
METRIC RANK

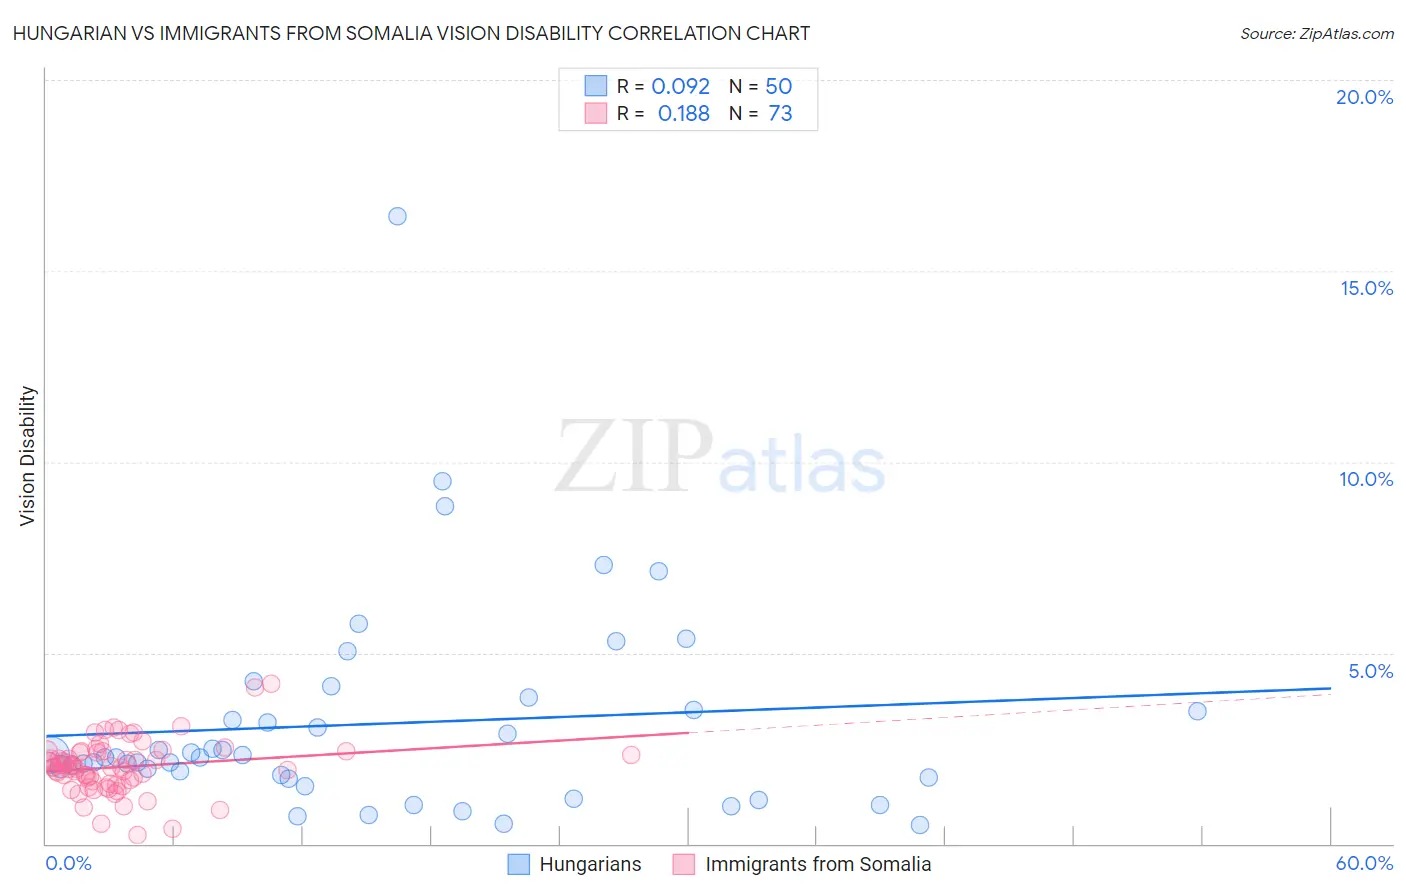
Hungarian vs Immigrants from Somalia Vision Disability Correlation Chart

The statistical analysis conducted on geographies consisting of 485,432,648 people shows a slight positive correlation between the proportion of Hungarians and percentage of population with vision disability in the United States with a correlation coefficient (R) of 0.092 and weighted average of 2.1%. Similarly, the statistical analysis conducted on geographies consisting of 92,068,110 people shows a poor positive correlation between the proportion of Immigrants from Somalia and percentage of population with vision disability in the United States with a correlation coefficient (R) of 0.188 and weighted average of 2.1%, a difference of 4.2%.
Hungarian vs Immigrants from Somalia Vision Disability

Vision Disability Correlation Summary

MeasurementHungarianImmigrants from Somalia
Minimum0.49%0.23%
Maximum16.4%4.2%
Range15.9%4.0%
Mean3.1%2.0%
Median2.3%2.0%
Interquartile 25% (IQ1)1.7%1.6%
Interquartile 75% (IQ3)3.5%2.4%
Interquartile Range (IQR)1.8%0.80%
Standard Deviation (Sample)2.8%0.70%
Standard Deviation (Population)2.8%0.69%

Similar Demographics by Vision Disability

Demographics Similar to Hungarians by Vision Disability

In terms of vision disability, the demographic groups most similar to Hungarians are Iraqi (2.1%, a difference of 0.030%), Icelander (2.1%, a difference of 0.090%), Austrian (2.1%, a difference of 0.12%), Immigrants from Bangladesh (2.1%, a difference of 0.13%), and South African (2.1%, a difference of 0.18%).
DemographicsRating | RankVision Disability
Immigrants | Colombia
72.1
/100
|
#155
Good
2.1%
Pakistanis
71.6
/100
|
#156
Good
2.1%
Serbians
70.2
/100
|
#157
Good
2.1%
Immigrants | Uzbekistan
69.9
/100
|
#158
Good
2.1%
South Africans
69.8
/100
|
#159
Good
2.1%
Austrians
69.0
/100
|
#160
Good
2.1%
Iraqis
67.7
/100
|
#161
Good
2.1%
Hungarians
67.4
/100
|
#162
Good
2.1%
Icelanders
66.1
/100
|
#163
Good
2.1%
Immigrants | Bangladesh
65.5
/100
|
#164
Good
2.1%
Immigrants | Iraq
64.8
/100
|
#165
Good
2.1%
Immigrants | England
62.8
/100
|
#166
Good
2.1%
Immigrants | Africa
62.6
/100
|
#167
Good
2.1%
Brazilians
62.2
/100
|
#168
Good
2.1%
South American Indians
57.4
/100
|
#169
Average
2.2%

Demographics Similar to Immigrants from Somalia by Vision Disability

In terms of vision disability, the demographic groups most similar to Immigrants from Somalia are Immigrants from Syria (2.1%, a difference of 0.020%), Immigrants from Europe (2.1%, a difference of 0.060%), Immigrants from Croatia (2.1%, a difference of 0.090%), Australian (2.1%, a difference of 0.16%), and Romanian (2.1%, a difference of 0.22%).
DemographicsRating | RankVision Disability
Immigrants | Latvia
97.3
/100
|
#84
Exceptional
2.0%
Chinese
97.2
/100
|
#85
Exceptional
2.0%
Immigrants | Moldova
97.2
/100
|
#86
Exceptional
2.0%
Immigrants | Switzerland
97.0
/100
|
#87
Exceptional
2.0%
Norwegians
97.0
/100
|
#88
Exceptional
2.0%
Immigrants | Eastern Africa
97.0
/100
|
#89
Exceptional
2.0%
Immigrants | Lebanon
96.7
/100
|
#90
Exceptional
2.1%
Immigrants | Somalia
96.2
/100
|
#91
Exceptional
2.1%
Immigrants | Syria
96.2
/100
|
#92
Exceptional
2.1%
Immigrants | Europe
96.1
/100
|
#93
Exceptional
2.1%
Immigrants | Croatia
96.0
/100
|
#94
Exceptional
2.1%
Australians
95.9
/100
|
#95
Exceptional
2.1%
Romanians
95.7
/100
|
#96
Exceptional
2.1%
Immigrants | Afghanistan
95.6
/100
|
#97
Exceptional
2.1%
Immigrants | South Africa
95.4
/100
|
#98
Exceptional
2.1%