Hungarian vs Burmese Vision Disability

COMPARE

Hungarian
Race
Ancestry
AfghanAfricanAlaska NativeAlaskan AthabascanAlbanianAleutAlsatianAmericanApacheArabArapahoArgentineanArmenianAssyrian/Chaldean/SyriacAustralianAustrianBahamianBangladeshiBarbadianBasqueBelgianBelizeanBermudanBhutaneseBlackfeetBolivianBrazilianBritishBritish West IndianBulgarianCajunCambodianCanadianCape VerdeanCarpatho RusynCelticCentral AmericanCentral American IndianCherokeeCheyenneChickasawChileanChineseChippewaChoctawColombianColvilleComancheCosta RicanCreeCreekCroatianCrowCubanCypriotCzechCzechoslovakianDanishDelawareDominicanDutchDutch West IndianEastern EuropeanEcuadorianEgyptianEnglishEstonianEthiopianEuropeanFijianFilipinoFinnishFrenchFrench American IndianFrench CanadianGermanGerman RussianGhanaianGreekGuamanian/ChamorroGuatemalanGuyaneseHaitianHmongHonduranHopiHoumaHungarianIcelanderIndian (Asian)IndonesianInupiatIranianIraqiIrishIroquoisIsraeliItalianJamaicanJapaneseJordanianKenyanKiowaKoreanLaotianLatvianLebaneseLiberianLithuanianLumbeeLuxembourgerMacedonianMalaysianMalteseMarshalleseMenomineeMexicanMexican American IndianMongolianMoroccanNative HawaiianNavajoNepaleseNew ZealanderNicaraguanNigerianNorthern EuropeanNorwegianOkinawanOsageOttawaPaiutePakistaniPalestinianPanamanianParaguayanPennsylvania GermanPeruvianPimaPolishPortuguesePotawatomiPuebloPuerto RicanPuget Sound SalishRomanianRussianSalvadoranSamoanScandinavianScotch-IrishScottishSeminoleSenegaleseSerbianShoshoneSierra LeoneanSiouxSlavicSlovakSloveneSomaliSouth AfricanSouth AmericanSouth American IndianSoviet UnionSpaniardSpanishSpanish AmericanSpanish American IndianSri LankanSubsaharan AfricanSudaneseSwedishSwissSyrianTaiwaneseThaiTlingit-HaidaTohono O'OdhamTonganTrinidadian and TobagonianTsimshianTurkishU.S. Virgin IslanderUgandanUkrainianUruguayanUteVenezuelanVietnameseWelshWest IndianYakamaYaquiYugoslavianYumanYup'ikZimbabwean
Immigration
NonimmigrantsImmigrantsAfghanistanAfricaAlbaniaArgentinaArmeniaAsiaAustraliaAustriaBahamasBangladeshBarbadosBelarusBelgiumBelizeBoliviaBosnia and HerzegovinaBrazilBulgariaBurma/MyanmarCabo VerdeCambodiaCameroonCanadaCaribbeanCentral AmericaChileChinaColombiaCongoCosta RicaCroatiaCubaCzechoslovakiaDenmarkDominicaDominican RepublicEastern AfricaEastern AsiaEastern EuropeEcuadorEgyptEl SalvadorEnglandEritreaEthiopiaEuropeFijiFranceGermanyGhanaGreeceGrenadaGuatemalaGuyanaHaitiHondurasHong KongHungaryIndiaIndonesiaIranIraqIrelandIsraelItalyJamaicaJapanJordanKazakhstanKenyaKoreaKuwaitLaosLatin AmericaLatviaLebanonLiberiaLithuaniaMalaysiaMexicoMicronesiaMiddle AfricaMoldovaMoroccoNepalNetherlandsNicaraguaNigeriaNorth AmericaNorth MacedoniaNorthern AfricaNorthern EuropeNorwayOceaniaPakistanPanamaPeruPhilippinesPolandPortugalRomaniaRussiaSaudi ArabiaScotlandSenegalSerbiaSierra LeoneSingaporeSomaliaSouth AfricaSouth AmericaSouth Central AsiaSouth Eastern AsiaSouthern EuropeSpainSri LankaSt. Vincent and the GrenadinesSudanSwedenSwitzerlandSyriaTaiwanThailandTrinidad and TobagoTurkeyUgandaUkraineUruguayUzbekistanVenezuelaVietnamWest IndiesWestern AfricaWestern AsiaWestern EuropeYemenZaireZimbabweAzores
Burmese
Race
Ancestry
AfghanAfricanAlaska NativeAlaskan AthabascanAlbanianAleutAlsatianAmericanApacheArabArapahoArgentineanArmenianAssyrian/Chaldean/SyriacAustralianAustrianBahamianBangladeshiBarbadianBasqueBelgianBelizeanBermudanBhutaneseBlackfeetBolivianBrazilianBritishBritish West IndianBulgarianBurmeseCajunCambodianCanadianCape VerdeanCarpatho RusynCelticCentral AmericanCentral American IndianCherokeeCheyenneChickasawChileanChineseChippewaChoctawColombianColvilleComancheCosta RicanCreeCreekCroatianCrowCubanCypriotCzechCzechoslovakianDanishDelawareDominicanDutchDutch West IndianEastern EuropeanEcuadorianEgyptianEnglishEstonianEthiopianEuropeanFijianFilipinoFinnishFrenchFrench American IndianFrench CanadianGermanGerman RussianGhanaianGreekGuamanian/ChamorroGuatemalanGuyaneseHaitianHmongHonduranHopiHoumaIcelanderIndian (Asian)IndonesianInupiatIranianIraqiIrishIroquoisIsraeliItalianJamaicanJapaneseJordanianKenyanKiowaKoreanLaotianLatvianLebaneseLiberianLithuanianLumbeeLuxembourgerMacedonianMalaysianMalteseMarshalleseMenomineeMexicanMexican American IndianMongolianMoroccanNative HawaiianNavajoNepaleseNew ZealanderNicaraguanNigerianNorthern EuropeanNorwegianOkinawanOsageOttawaPaiutePakistaniPalestinianPanamanianParaguayanPennsylvania GermanPeruvianPimaPolishPortuguesePotawatomiPuebloPuerto RicanPuget Sound SalishRomanianRussianSalvadoranSamoanScandinavianScotch-IrishScottishSeminoleSenegaleseSerbianShoshoneSierra LeoneanSiouxSlavicSlovakSloveneSomaliSouth AfricanSouth AmericanSouth American IndianSoviet UnionSpaniardSpanishSpanish AmericanSpanish American IndianSri LankanSubsaharan AfricanSudaneseSwedishSwissSyrianTaiwaneseThaiTlingit-HaidaTohono O'OdhamTonganTrinidadian and TobagonianTsimshianTurkishU.S. Virgin IslanderUgandanUkrainianUruguayanUteVenezuelanVietnameseWelshWest IndianYakamaYaquiYugoslavianYumanYup'ikZimbabwean
Immigration
NonimmigrantsImmigrantsAfghanistanAfricaAlbaniaArgentinaArmeniaAsiaAustraliaAustriaBahamasBangladeshBarbadosBelarusBelgiumBelizeBoliviaBosnia and HerzegovinaBrazilBulgariaBurma/MyanmarCabo VerdeCambodiaCameroonCanadaCaribbeanCentral AmericaChileChinaColombiaCongoCosta RicaCroatiaCubaCzechoslovakiaDenmarkDominicaDominican RepublicEastern AfricaEastern AsiaEastern EuropeEcuadorEgyptEl SalvadorEnglandEritreaEthiopiaEuropeFijiFranceGermanyGhanaGreeceGrenadaGuatemalaGuyanaHaitiHondurasHong KongHungaryIndiaIndonesiaIranIraqIrelandIsraelItalyJamaicaJapanJordanKazakhstanKenyaKoreaKuwaitLaosLatin AmericaLatviaLebanonLiberiaLithuaniaMalaysiaMexicoMicronesiaMiddle AfricaMoldovaMoroccoNepalNetherlandsNicaraguaNigeriaNorth AmericaNorth MacedoniaNorthern AfricaNorthern EuropeNorwayOceaniaPakistanPanamaPeruPhilippinesPolandPortugalRomaniaRussiaSaudi ArabiaScotlandSenegalSerbiaSierra LeoneSingaporeSomaliaSouth AfricaSouth AmericaSouth Central AsiaSouth Eastern AsiaSouthern EuropeSpainSri LankaSt. Vincent and the GrenadinesSudanSwedenSwitzerlandSyriaTaiwanThailandTrinidad and TobagoTurkeyUgandaUkraineUruguayUzbekistanVenezuelaVietnamWest IndiesWestern AfricaWestern AsiaWestern EuropeYemenZaireZimbabweAzores
Vision Disability
Income
Poverty
Unemployment
Labor Participation
Family Structure
Vehicle Availability
Education Level
Disability

Vision Disability Comparison

Hungarians

Burmese

Good
Exceptional
2.1%
VISION DISABILITY
67.4/ 100
METRIC RATING
162nd/ 347
METRIC RANK
1.8%
VISION DISABILITY
100.0/ 100
METRIC RATING
17th/ 347
METRIC RANK

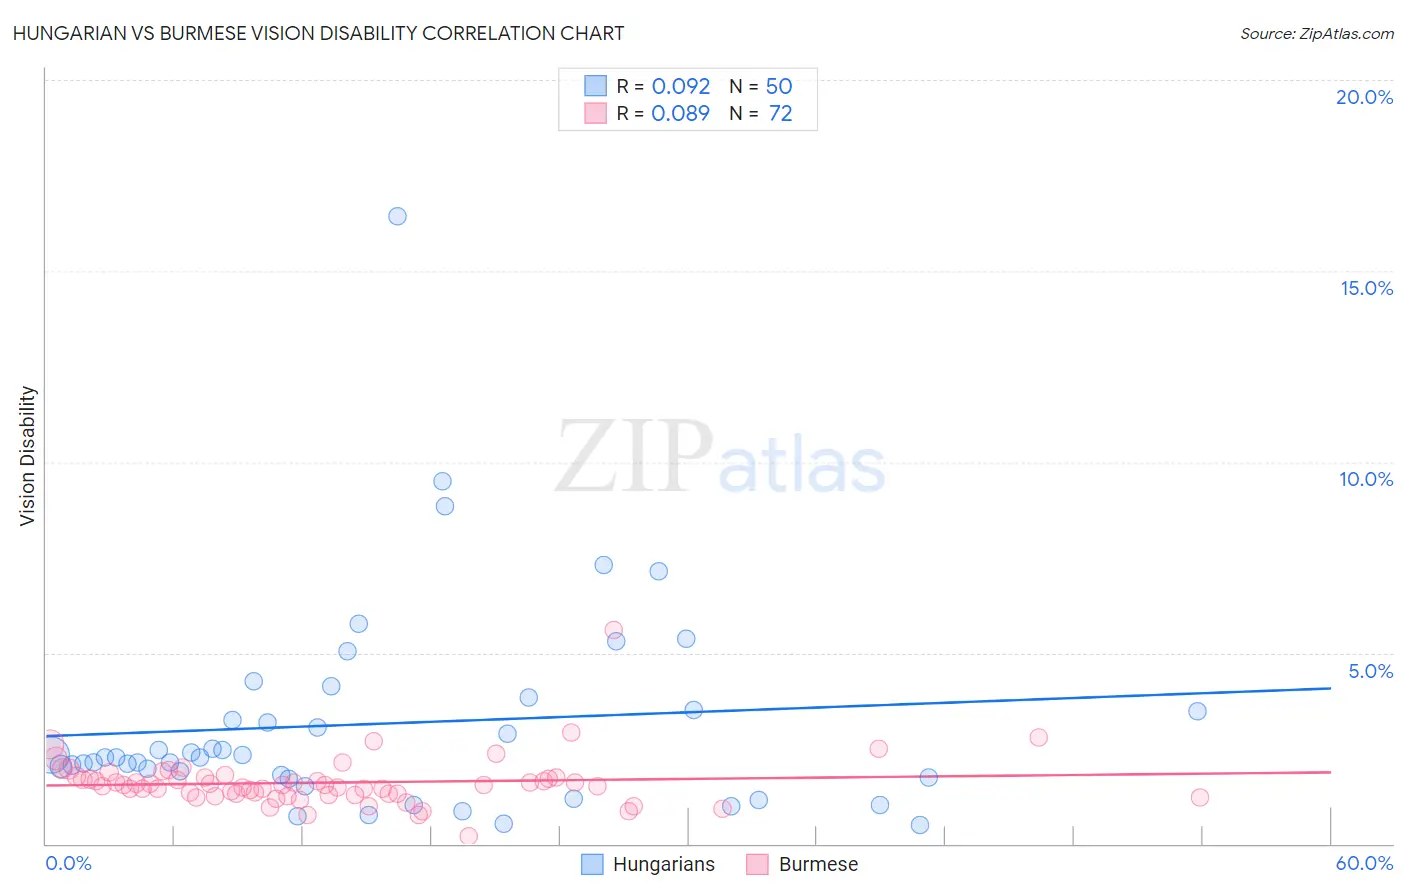
Hungarian vs Burmese Vision Disability Correlation Chart

The statistical analysis conducted on geographies consisting of 485,432,648 people shows a slight positive correlation between the proportion of Hungarians and percentage of population with vision disability in the United States with a correlation coefficient (R) of 0.092 and weighted average of 2.1%. Similarly, the statistical analysis conducted on geographies consisting of 464,767,032 people shows a slight positive correlation between the proportion of Burmese and percentage of population with vision disability in the United States with a correlation coefficient (R) of 0.089 and weighted average of 1.8%, a difference of 15.8%.
Hungarian vs Burmese Vision Disability

Vision Disability Correlation Summary

MeasurementHungarianBurmese
Minimum0.49%0.21%
Maximum16.4%5.6%
Range15.9%5.4%
Mean3.1%1.6%
Median2.3%1.5%
Interquartile 25% (IQ1)1.7%1.3%
Interquartile 75% (IQ3)3.5%1.7%
Interquartile Range (IQR)1.8%0.43%
Standard Deviation (Sample)2.8%0.68%
Standard Deviation (Population)2.8%0.67%

Similar Demographics by Vision Disability

Demographics Similar to Hungarians by Vision Disability

In terms of vision disability, the demographic groups most similar to Hungarians are Iraqi (2.1%, a difference of 0.030%), Icelander (2.1%, a difference of 0.090%), Austrian (2.1%, a difference of 0.12%), Immigrants from Bangladesh (2.1%, a difference of 0.13%), and South African (2.1%, a difference of 0.18%).
DemographicsRating | RankVision Disability
Immigrants | Colombia
72.1
/100
|
#155
Good
2.1%
Pakistanis
71.6
/100
|
#156
Good
2.1%
Serbians
70.2
/100
|
#157
Good
2.1%
Immigrants | Uzbekistan
69.9
/100
|
#158
Good
2.1%
South Africans
69.8
/100
|
#159
Good
2.1%
Austrians
69.0
/100
|
#160
Good
2.1%
Iraqis
67.7
/100
|
#161
Good
2.1%
Hungarians
67.4
/100
|
#162
Good
2.1%
Icelanders
66.1
/100
|
#163
Good
2.1%
Immigrants | Bangladesh
65.5
/100
|
#164
Good
2.1%
Immigrants | Iraq
64.8
/100
|
#165
Good
2.1%
Immigrants | England
62.8
/100
|
#166
Good
2.1%
Immigrants | Africa
62.6
/100
|
#167
Good
2.1%
Brazilians
62.2
/100
|
#168
Good
2.1%
South American Indians
57.4
/100
|
#169
Average
2.2%

Demographics Similar to Burmese by Vision Disability

In terms of vision disability, the demographic groups most similar to Burmese are Indian (Asian) (1.8%, a difference of 0.010%), Bolivian (1.9%, a difference of 0.42%), Immigrants from Bolivia (1.8%, a difference of 0.45%), Immigrants from China (1.8%, a difference of 0.87%), and Immigrants from Eastern Asia (1.8%, a difference of 1.0%).
DemographicsRating | RankVision Disability
Immigrants | Hong Kong
100.0
/100
|
#10
Exceptional
1.8%
Immigrants | Israel
100.0
/100
|
#11
Exceptional
1.8%
Immigrants | Korea
100.0
/100
|
#12
Exceptional
1.8%
Immigrants | Eastern Asia
100.0
/100
|
#13
Exceptional
1.8%
Immigrants | China
100.0
/100
|
#14
Exceptional
1.8%
Immigrants | Bolivia
100.0
/100
|
#15
Exceptional
1.8%
Indians (Asian)
100.0
/100
|
#16
Exceptional
1.8%
Burmese
100.0
/100
|
#17
Exceptional
1.8%
Bolivians
100.0
/100
|
#18
Exceptional
1.9%
Immigrants | Sri Lanka
100.0
/100
|
#19
Exceptional
1.9%
Asians
100.0
/100
|
#20
Exceptional
1.9%
Turks
100.0
/100
|
#21
Exceptional
1.9%
Immigrants | Pakistan
100.0
/100
|
#22
Exceptional
1.9%
Immigrants | Asia
99.9
/100
|
#23
Exceptional
1.9%
Immigrants | Lithuania
99.9
/100
|
#24
Exceptional
1.9%