Hungarian vs Canadian Male Disability
COMPARE
Hungarian
Canadian
Male Disability
Male Disability Comparison
Hungarians
Canadians
12.0%
MALE DISABILITY
0.8/ 100
METRIC RATING
247th/ 347
METRIC RANK
12.2%
MALE DISABILITY
0.2/ 100
METRIC RATING
263rd/ 347
METRIC RANK
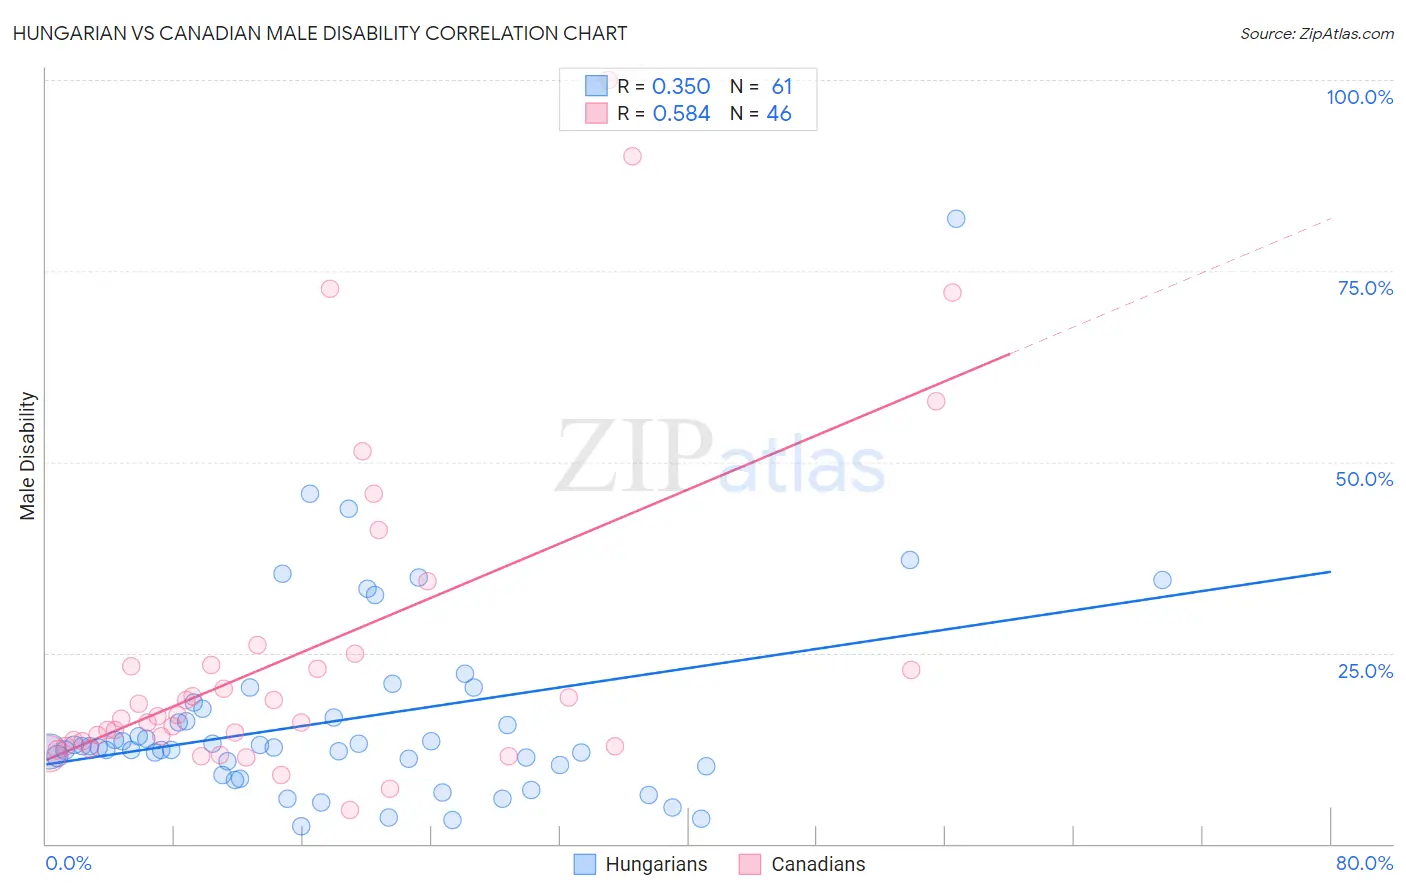
Hungarian vs Canadian Male Disability Correlation Chart
The statistical analysis conducted on geographies consisting of 486,137,114 people shows a mild positive correlation between the proportion of Hungarians and percentage of males with a disability in the United States with a correlation coefficient (R) of 0.350 and weighted average of 12.0%. Similarly, the statistical analysis conducted on geographies consisting of 437,467,484 people shows a substantial positive correlation between the proportion of Canadians and percentage of males with a disability in the United States with a correlation coefficient (R) of 0.584 and weighted average of 12.2%, a difference of 2.0%.
Male Disability Correlation Summary
| Measurement | Hungarian | Canadian |
| Minimum | 2.3% | 4.4% |
| Maximum | 81.8% | 100.0% |
| Range | 79.5% | 95.6% |
| Mean | 16.2% | 25.0% |
| Median | 12.6% | 16.5% |
| Interquartile 25% (IQ1) | 10.2% | 12.7% |
| Interquartile 75% (IQ3) | 17.1% | 23.4% |
| Interquartile Range (IQR) | 6.9% | 10.7% |
| Standard Deviation (Sample) | 13.0% | 21.6% |
| Standard Deviation (Population) | 12.9% | 21.3% |
Demographics Similar to Hungarians and Canadians by Male Disability
In terms of male disability, the demographic groups most similar to Hungarians are Polish (12.0%, a difference of 0.18%), Danish (11.9%, a difference of 0.19%), Immigrants from Liberia (11.9%, a difference of 0.22%), Immigrants from Yemen (12.0%, a difference of 0.54%), and Bangladeshi (12.0%, a difference of 0.59%). Similarly, the demographic groups most similar to Canadians are Nepalese (12.2%, a difference of 0.030%), Norwegian (12.2%, a difference of 0.20%), Slavic (12.2%, a difference of 0.21%), Immigrants from Portugal (12.3%, a difference of 0.49%), and Swedish (12.1%, a difference of 0.57%).
| Demographics | Rating | Rank | Male Disability |
| Immigrants | Liberia | 1.0 /100 | #245 | Tragic 11.9% |
| Danes | 0.9 /100 | #246 | Tragic 11.9% |
| Hungarians | 0.8 /100 | #247 | Tragic 12.0% |
| Poles | 0.7 /100 | #248 | Tragic 12.0% |
| Immigrants | Yemen | 0.5 /100 | #249 | Tragic 12.0% |
| Bangladeshis | 0.5 /100 | #250 | Tragic 12.0% |
| German Russians | 0.5 /100 | #251 | Tragic 12.0% |
| Slovenes | 0.5 /100 | #252 | Tragic 12.0% |
| Guamanians/Chamorros | 0.5 /100 | #253 | Tragic 12.0% |
| British | 0.4 /100 | #254 | Tragic 12.1% |
| Chinese | 0.4 /100 | #255 | Tragic 12.1% |
| Swiss | 0.3 /100 | #256 | Tragic 12.1% |
| Europeans | 0.3 /100 | #257 | Tragic 12.1% |
| Basques | 0.3 /100 | #258 | Tragic 12.1% |
| Belgians | 0.3 /100 | #259 | Tragic 12.1% |
| Swedes | 0.3 /100 | #260 | Tragic 12.1% |
| Slavs | 0.2 /100 | #261 | Tragic 12.2% |
| Norwegians | 0.2 /100 | #262 | Tragic 12.2% |
| Canadians | 0.2 /100 | #263 | Tragic 12.2% |
| Nepalese | 0.2 /100 | #264 | Tragic 12.2% |
| Immigrants | Portugal | 0.1 /100 | #265 | Tragic 12.3% |