Honduran vs Blackfeet Disability Age 65 to 74
COMPARE
Honduran
Blackfeet
Disability Age 65 to 74
Disability Age 65 to 74 Comparison
Hondurans
Blackfeet
25.8%
DISABILITY AGE 65 TO 74
0.1/ 100
METRIC RATING
275th/ 347
METRIC RANK
26.6%
DISABILITY AGE 65 TO 74
0.0/ 100
METRIC RATING
292nd/ 347
METRIC RANK
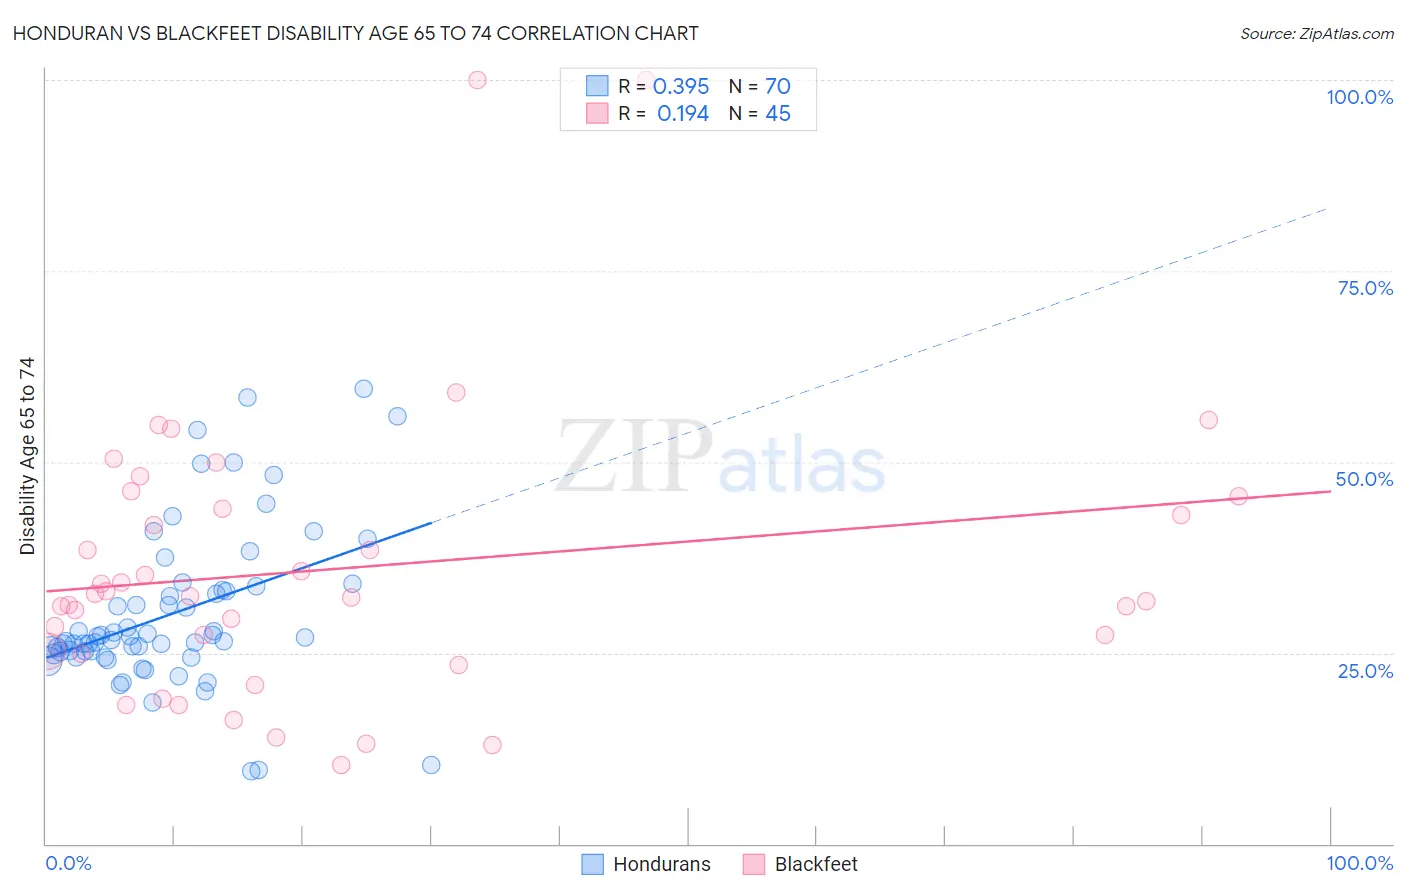
Honduran vs Blackfeet Disability Age 65 to 74 Correlation Chart
The statistical analysis conducted on geographies consisting of 357,197,104 people shows a mild positive correlation between the proportion of Hondurans and percentage of population with a disability between the ages 65 and 75 in the United States with a correlation coefficient (R) of 0.395 and weighted average of 25.8%. Similarly, the statistical analysis conducted on geographies consisting of 309,087,362 people shows a poor positive correlation between the proportion of Blackfeet and percentage of population with a disability between the ages 65 and 75 in the United States with a correlation coefficient (R) of 0.194 and weighted average of 26.6%, a difference of 3.0%.
Disability Age 65 to 74 Correlation Summary
| Measurement | Honduran | Blackfeet |
| Minimum | 9.5% | 10.2% |
| Maximum | 59.5% | 100.0% |
| Range | 50.0% | 89.8% |
| Mean | 30.1% | 36.1% |
| Median | 26.8% | 32.3% |
| Interquartile 25% (IQ1) | 25.2% | 25.1% |
| Interquartile 75% (IQ3) | 33.2% | 44.6% |
| Interquartile Range (IQR) | 8.0% | 19.6% |
| Standard Deviation (Sample) | 10.4% | 18.6% |
| Standard Deviation (Population) | 10.3% | 18.4% |
Demographics Similar to Hondurans and Blackfeet by Disability Age 65 to 74
In terms of disability age 65 to 74, the demographic groups most similar to Hondurans are American (25.8%, a difference of 0.010%), French American Indian (25.8%, a difference of 0.010%), Belizean (25.8%, a difference of 0.10%), Immigrants from Belize (25.8%, a difference of 0.13%), and U.S. Virgin Islander (25.9%, a difference of 0.21%). Similarly, the demographic groups most similar to Blackfeet are Immigrants from Central America (26.6%, a difference of 0.16%), Spanish American Indian (26.4%, a difference of 0.88%), Immigrants from Cabo Verde (26.3%, a difference of 1.1%), African (26.2%, a difference of 1.4%), and Mexican American Indian (26.2%, a difference of 1.7%).
| Demographics | Rating | Rank | Disability Age 65 to 74 |
| Japanese | 0.1 /100 | #273 | Tragic 25.7% |
| Americans | 0.1 /100 | #274 | Tragic 25.8% |
| Hondurans | 0.1 /100 | #275 | Tragic 25.8% |
| French American Indians | 0.1 /100 | #276 | Tragic 25.8% |
| Belizeans | 0.1 /100 | #277 | Tragic 25.8% |
| Immigrants | Belize | 0.1 /100 | #278 | Tragic 25.8% |
| U.S. Virgin Islanders | 0.1 /100 | #279 | Tragic 25.9% |
| Cree | 0.1 /100 | #280 | Tragic 25.9% |
| Immigrants | Honduras | 0.1 /100 | #281 | Tragic 25.9% |
| Delaware | 0.1 /100 | #282 | Tragic 25.9% |
| Spanish Americans | 0.0 /100 | #283 | Tragic 25.9% |
| Immigrants | Azores | 0.0 /100 | #284 | Tragic 26.0% |
| Immigrants | Congo | 0.0 /100 | #285 | Tragic 26.0% |
| Immigrants | Micronesia | 0.0 /100 | #286 | Tragic 26.1% |
| Immigrants | Laos | 0.0 /100 | #287 | Tragic 26.1% |
| Mexican American Indians | 0.0 /100 | #288 | Tragic 26.2% |
| Africans | 0.0 /100 | #289 | Tragic 26.2% |
| Immigrants | Cabo Verde | 0.0 /100 | #290 | Tragic 26.3% |
| Spanish American Indians | 0.0 /100 | #291 | Tragic 26.4% |
| Blackfeet | 0.0 /100 | #292 | Tragic 26.6% |
| Immigrants | Central America | 0.0 /100 | #293 | Tragic 26.6% |