Comanche vs Blackfeet Disability Age 65 to 74
COMPARE
Comanche
Blackfeet
Disability Age 65 to 74
Disability Age 65 to 74 Comparison
Comanche
Blackfeet
28.3%
DISABILITY AGE 65 TO 74
0.0/ 100
METRIC RATING
321st/ 347
METRIC RANK
26.6%
DISABILITY AGE 65 TO 74
0.0/ 100
METRIC RATING
292nd/ 347
METRIC RANK
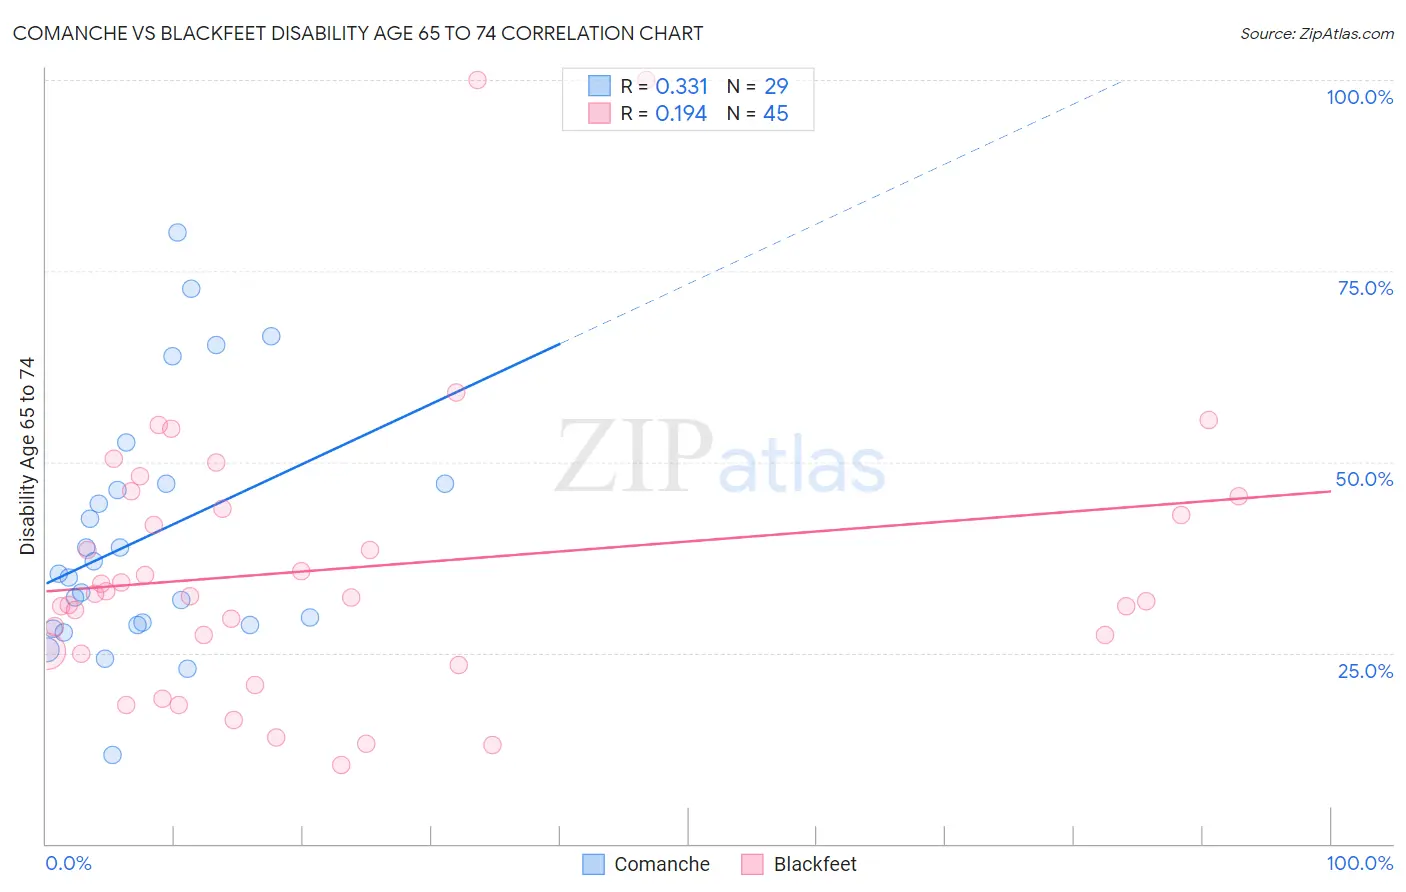
Comanche vs Blackfeet Disability Age 65 to 74 Correlation Chart
The statistical analysis conducted on geographies consisting of 109,698,765 people shows a mild positive correlation between the proportion of Comanche and percentage of population with a disability between the ages 65 and 75 in the United States with a correlation coefficient (R) of 0.331 and weighted average of 28.3%. Similarly, the statistical analysis conducted on geographies consisting of 309,087,362 people shows a poor positive correlation between the proportion of Blackfeet and percentage of population with a disability between the ages 65 and 75 in the United States with a correlation coefficient (R) of 0.194 and weighted average of 26.6%, a difference of 6.6%.
Disability Age 65 to 74 Correlation Summary
| Measurement | Comanche | Blackfeet |
| Minimum | 11.6% | 10.2% |
| Maximum | 80.0% | 100.0% |
| Range | 68.4% | 89.8% |
| Mean | 40.2% | 36.1% |
| Median | 35.3% | 32.3% |
| Interquartile 25% (IQ1) | 28.6% | 25.1% |
| Interquartile 75% (IQ3) | 47.1% | 44.6% |
| Interquartile Range (IQR) | 18.5% | 19.6% |
| Standard Deviation (Sample) | 16.3% | 18.6% |
| Standard Deviation (Population) | 16.1% | 18.4% |
Similar Demographics by Disability Age 65 to 74
Demographics Similar to Comanche by Disability Age 65 to 74
In terms of disability age 65 to 74, the demographic groups most similar to Comanche are Aleut (28.4%, a difference of 0.33%), Cherokee (28.2%, a difference of 0.51%), Arapaho (28.1%, a difference of 0.89%), Nepalese (28.0%, a difference of 1.1%), and Immigrants from Armenia (28.0%, a difference of 1.3%).
| Demographics | Rating | Rank | Disability Age 65 to 74 |
| Chippewa | 0.0 /100 | #314 | Tragic 27.8% |
| Cajuns | 0.0 /100 | #315 | Tragic 27.9% |
| Crow | 0.0 /100 | #316 | Tragic 27.9% |
| Immigrants | Armenia | 0.0 /100 | #317 | Tragic 28.0% |
| Nepalese | 0.0 /100 | #318 | Tragic 28.0% |
| Arapaho | 0.0 /100 | #319 | Tragic 28.1% |
| Cherokee | 0.0 /100 | #320 | Tragic 28.2% |
| Comanche | 0.0 /100 | #321 | Tragic 28.3% |
| Aleuts | 0.0 /100 | #322 | Tragic 28.4% |
| Puerto Ricans | 0.0 /100 | #323 | Tragic 29.1% |
| Seminole | 0.0 /100 | #324 | Tragic 29.4% |
| Dutch West Indians | 0.0 /100 | #325 | Tragic 29.6% |
| Yakama | 0.0 /100 | #326 | Tragic 29.6% |
| Apache | 0.0 /100 | #327 | Tragic 29.7% |
| Hopi | 0.0 /100 | #328 | Tragic 30.0% |
Demographics Similar to Blackfeet by Disability Age 65 to 74
In terms of disability age 65 to 74, the demographic groups most similar to Blackfeet are Immigrants from Central America (26.6%, a difference of 0.16%), Dominican (26.7%, a difference of 0.28%), Hispanic or Latino (26.7%, a difference of 0.30%), Spanish American Indian (26.4%, a difference of 0.88%), and Bangladeshi (26.8%, a difference of 0.91%).
| Demographics | Rating | Rank | Disability Age 65 to 74 |
| Immigrants | Congo | 0.0 /100 | #285 | Tragic 26.0% |
| Immigrants | Micronesia | 0.0 /100 | #286 | Tragic 26.1% |
| Immigrants | Laos | 0.0 /100 | #287 | Tragic 26.1% |
| Mexican American Indians | 0.0 /100 | #288 | Tragic 26.2% |
| Africans | 0.0 /100 | #289 | Tragic 26.2% |
| Immigrants | Cabo Verde | 0.0 /100 | #290 | Tragic 26.3% |
| Spanish American Indians | 0.0 /100 | #291 | Tragic 26.4% |
| Blackfeet | 0.0 /100 | #292 | Tragic 26.6% |
| Immigrants | Central America | 0.0 /100 | #293 | Tragic 26.6% |
| Dominicans | 0.0 /100 | #294 | Tragic 26.7% |
| Hispanics or Latinos | 0.0 /100 | #295 | Tragic 26.7% |
| Bangladeshis | 0.0 /100 | #296 | Tragic 26.8% |
| Fijians | 0.0 /100 | #297 | Tragic 27.0% |
| Immigrants | Yemen | 0.0 /100 | #298 | Tragic 27.0% |
| Potawatomi | 0.0 /100 | #299 | Tragic 27.0% |