Guatemalan vs Scandinavian Disability Age 35 to 64
COMPARE
Guatemalan
Scandinavian
Disability Age 35 to 64
Disability Age 35 to 64 Comparison
Guatemalans
Scandinavians
11.7%
DISABILITY AGE 35 TO 64
14.6/ 100
METRIC RATING
208th/ 347
METRIC RANK
11.9%
DISABILITY AGE 35 TO 64
6.4/ 100
METRIC RATING
226th/ 347
METRIC RANK
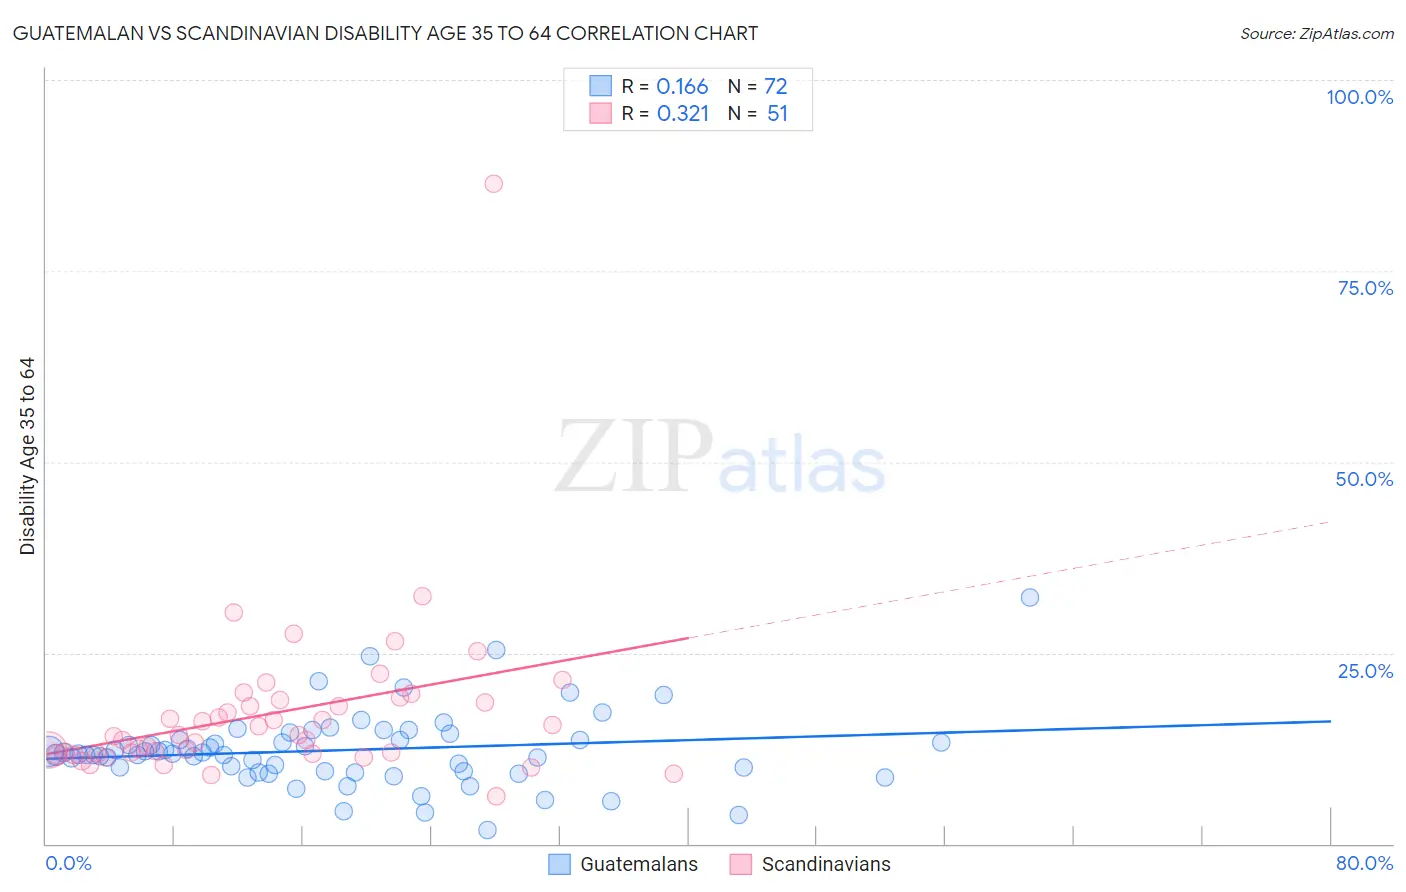
Guatemalan vs Scandinavian Disability Age 35 to 64 Correlation Chart
The statistical analysis conducted on geographies consisting of 409,236,558 people shows a poor positive correlation between the proportion of Guatemalans and percentage of population with a disability between the ages 34 and 64 in the United States with a correlation coefficient (R) of 0.166 and weighted average of 11.7%. Similarly, the statistical analysis conducted on geographies consisting of 472,157,412 people shows a mild positive correlation between the proportion of Scandinavians and percentage of population with a disability between the ages 34 and 64 in the United States with a correlation coefficient (R) of 0.321 and weighted average of 11.9%, a difference of 1.8%.
Disability Age 35 to 64 Correlation Summary
| Measurement | Guatemalan | Scandinavian |
| Minimum | 1.8% | 6.2% |
| Maximum | 32.3% | 86.4% |
| Range | 30.4% | 80.1% |
| Mean | 12.2% | 17.1% |
| Median | 11.7% | 14.2% |
| Interquartile 25% (IQ1) | 9.5% | 11.8% |
| Interquartile 75% (IQ3) | 13.6% | 18.8% |
| Interquartile Range (IQR) | 4.1% | 6.9% |
| Standard Deviation (Sample) | 4.9% | 11.3% |
| Standard Deviation (Population) | 4.9% | 11.2% |
Demographics Similar to Guatemalans and Scandinavians by Disability Age 35 to 64
In terms of disability age 35 to 64, the demographic groups most similar to Guatemalans are Ghanaian (11.7%, a difference of 0.030%), European (11.7%, a difference of 0.19%), Belgian (11.7%, a difference of 0.26%), Canadian (11.7%, a difference of 0.27%), and Immigrants from Jamaica (11.7%, a difference of 0.49%). Similarly, the demographic groups most similar to Scandinavians are Immigrants from Central America (11.9%, a difference of 0.030%), Immigrants from Belize (11.9%, a difference of 0.080%), Immigrants from Ghana (11.8%, a difference of 0.43%), Immigrants from Honduras (11.8%, a difference of 0.58%), and Honduran (11.8%, a difference of 0.59%).
| Demographics | Rating | Rank | Disability Age 35 to 64 |
| Ghanaians | 14.8 /100 | #207 | Poor 11.7% |
| Guatemalans | 14.6 /100 | #208 | Poor 11.7% |
| Europeans | 13.5 /100 | #209 | Poor 11.7% |
| Belgians | 13.1 /100 | #210 | Poor 11.7% |
| Canadians | 13.0 /100 | #211 | Poor 11.7% |
| Immigrants | Jamaica | 11.8 /100 | #212 | Poor 11.7% |
| Yugoslavians | 11.6 /100 | #213 | Poor 11.7% |
| Immigrants | Sudan | 11.4 /100 | #214 | Poor 11.7% |
| Spanish American Indians | 11.1 /100 | #215 | Poor 11.7% |
| Bahamians | 10.7 /100 | #216 | Poor 11.8% |
| Barbadians | 9.5 /100 | #217 | Tragic 11.8% |
| Immigrants | Bahamas | 9.2 /100 | #218 | Tragic 11.8% |
| Czechoslovakians | 9.0 /100 | #219 | Tragic 11.8% |
| Immigrants | West Indies | 8.9 /100 | #220 | Tragic 11.8% |
| Alsatians | 8.5 /100 | #221 | Tragic 11.8% |
| Hondurans | 8.4 /100 | #222 | Tragic 11.8% |
| Immigrants | Honduras | 8.4 /100 | #223 | Tragic 11.8% |
| Immigrants | Ghana | 7.8 /100 | #224 | Tragic 11.8% |
| Immigrants | Belize | 6.6 /100 | #225 | Tragic 11.9% |
| Scandinavians | 6.4 /100 | #226 | Tragic 11.9% |
| Immigrants | Central America | 6.3 /100 | #227 | Tragic 11.9% |