Guatemalan vs German Russian Disability Age 35 to 64
COMPARE
Guatemalan
German Russian
Disability Age 35 to 64
Disability Age 35 to 64 Comparison
Guatemalans
German Russians
11.7%
DISABILITY AGE 35 TO 64
14.6/ 100
METRIC RATING
208th/ 347
METRIC RANK
12.5%
DISABILITY AGE 35 TO 64
0.5/ 100
METRIC RATING
260th/ 347
METRIC RANK
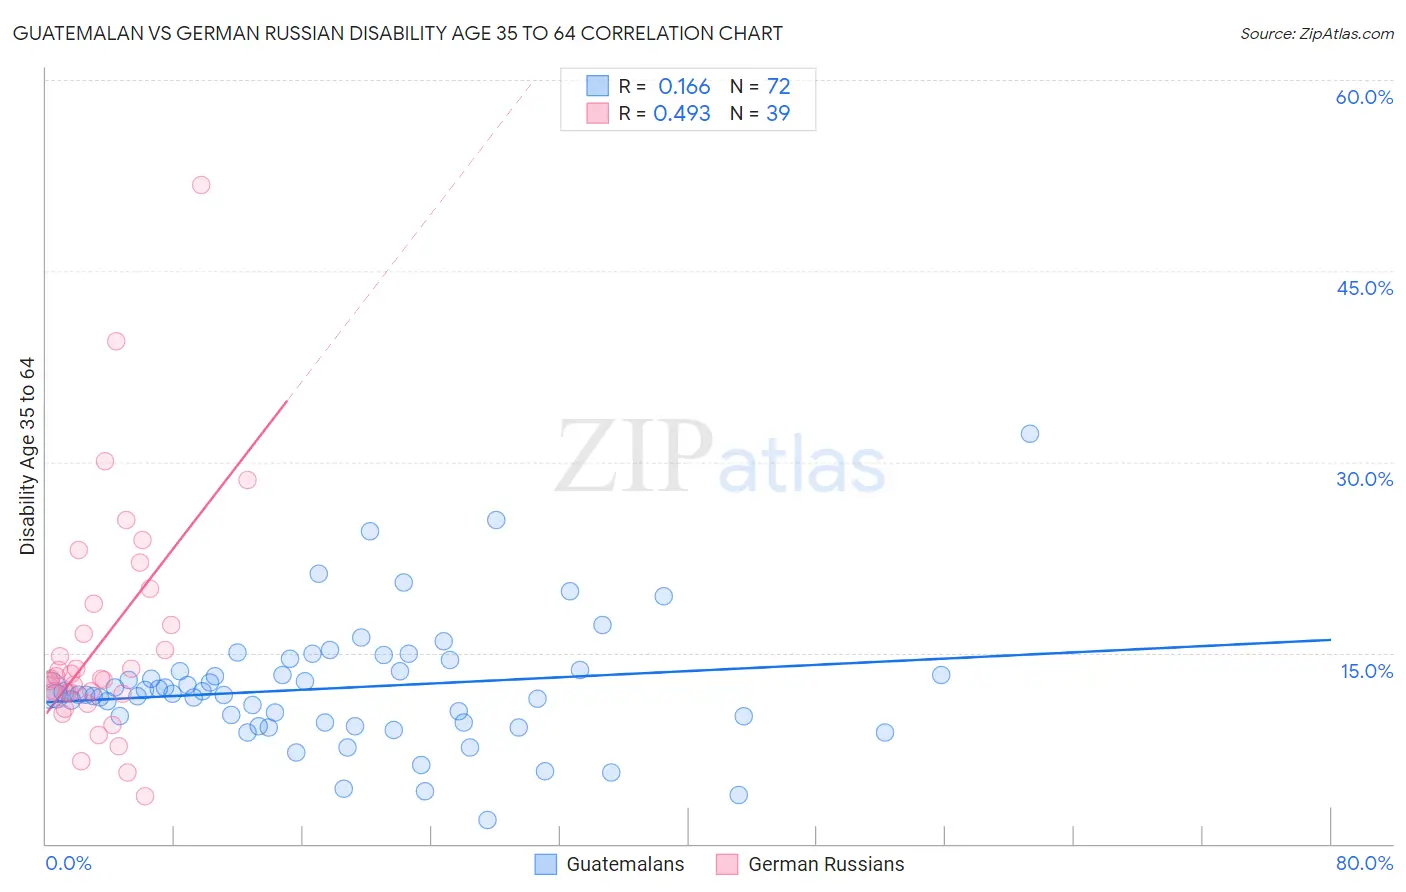
Guatemalan vs German Russian Disability Age 35 to 64 Correlation Chart
The statistical analysis conducted on geographies consisting of 409,236,558 people shows a poor positive correlation between the proportion of Guatemalans and percentage of population with a disability between the ages 34 and 64 in the United States with a correlation coefficient (R) of 0.166 and weighted average of 11.7%. Similarly, the statistical analysis conducted on geographies consisting of 96,440,247 people shows a moderate positive correlation between the proportion of German Russians and percentage of population with a disability between the ages 34 and 64 in the United States with a correlation coefficient (R) of 0.493 and weighted average of 12.5%, a difference of 6.8%.
Disability Age 35 to 64 Correlation Summary
| Measurement | Guatemalan | German Russian |
| Minimum | 1.8% | 3.7% |
| Maximum | 32.3% | 51.7% |
| Range | 30.4% | 48.0% |
| Mean | 12.2% | 16.0% |
| Median | 11.7% | 13.0% |
| Interquartile 25% (IQ1) | 9.5% | 11.8% |
| Interquartile 75% (IQ3) | 13.6% | 18.8% |
| Interquartile Range (IQR) | 4.1% | 7.1% |
| Standard Deviation (Sample) | 4.9% | 9.2% |
| Standard Deviation (Population) | 4.9% | 9.1% |
Similar Demographics by Disability Age 35 to 64
Demographics Similar to Guatemalans by Disability Age 35 to 64
In terms of disability age 35 to 64, the demographic groups most similar to Guatemalans are Native Hawaiian (11.7%, a difference of 0.030%), Ghanaian (11.7%, a difference of 0.030%), Slavic (11.7%, a difference of 0.13%), European (11.7%, a difference of 0.19%), and Nigerian (11.6%, a difference of 0.25%).
| Demographics | Rating | Rank | Disability Age 35 to 64 |
| Immigrants | Kenya | 17.7 /100 | #201 | Poor 11.6% |
| Immigrants | Guatemala | 17.5 /100 | #202 | Poor 11.6% |
| British | 17.0 /100 | #203 | Poor 11.6% |
| Nigerians | 16.3 /100 | #204 | Poor 11.6% |
| Slavs | 15.5 /100 | #205 | Poor 11.7% |
| Native Hawaiians | 14.8 /100 | #206 | Poor 11.7% |
| Ghanaians | 14.8 /100 | #207 | Poor 11.7% |
| Guatemalans | 14.6 /100 | #208 | Poor 11.7% |
| Europeans | 13.5 /100 | #209 | Poor 11.7% |
| Belgians | 13.1 /100 | #210 | Poor 11.7% |
| Canadians | 13.0 /100 | #211 | Poor 11.7% |
| Immigrants | Jamaica | 11.8 /100 | #212 | Poor 11.7% |
| Yugoslavians | 11.6 /100 | #213 | Poor 11.7% |
| Immigrants | Sudan | 11.4 /100 | #214 | Poor 11.7% |
| Spanish American Indians | 11.1 /100 | #215 | Poor 11.7% |
Demographics Similar to German Russians by Disability Age 35 to 64
In terms of disability age 35 to 64, the demographic groups most similar to German Russians are Malaysian (12.5%, a difference of 0.15%), Senegalese (12.5%, a difference of 0.23%), English (12.4%, a difference of 0.25%), Welsh (12.4%, a difference of 0.37%), and Mexican (12.4%, a difference of 0.46%).
| Demographics | Rating | Rank | Disability Age 35 to 64 |
| Dutch | 1.0 /100 | #253 | Tragic 12.3% |
| Hawaiians | 0.9 /100 | #254 | Tragic 12.3% |
| Japanese | 0.8 /100 | #255 | Tragic 12.3% |
| Scottish | 0.8 /100 | #256 | Tragic 12.4% |
| Mexicans | 0.7 /100 | #257 | Tragic 12.4% |
| Welsh | 0.6 /100 | #258 | Tragic 12.4% |
| English | 0.6 /100 | #259 | Tragic 12.4% |
| German Russians | 0.5 /100 | #260 | Tragic 12.5% |
| Malaysians | 0.5 /100 | #261 | Tragic 12.5% |
| Senegalese | 0.5 /100 | #262 | Tragic 12.5% |
| Immigrants | Zaire | 0.4 /100 | #263 | Tragic 12.5% |
| Immigrants | Portugal | 0.4 /100 | #264 | Tragic 12.5% |
| Marshallese | 0.4 /100 | #265 | Tragic 12.5% |
| Whites/Caucasians | 0.3 /100 | #266 | Tragic 12.6% |
| Sub-Saharan Africans | 0.2 /100 | #267 | Tragic 12.6% |