French Canadian vs Immigrants from South Central Asia Disability Age 18 to 34
COMPARE
French Canadian
Immigrants from South Central Asia
Disability Age 18 to 34
Disability Age 18 to 34 Comparison
French Canadians
Immigrants from South Central Asia
8.1%
DISABILITY AGE 18 TO 34
0.0/ 100
METRIC RATING
318th/ 347
METRIC RANK
5.7%
DISABILITY AGE 18 TO 34
100.0/ 100
METRIC RATING
21st/ 347
METRIC RANK
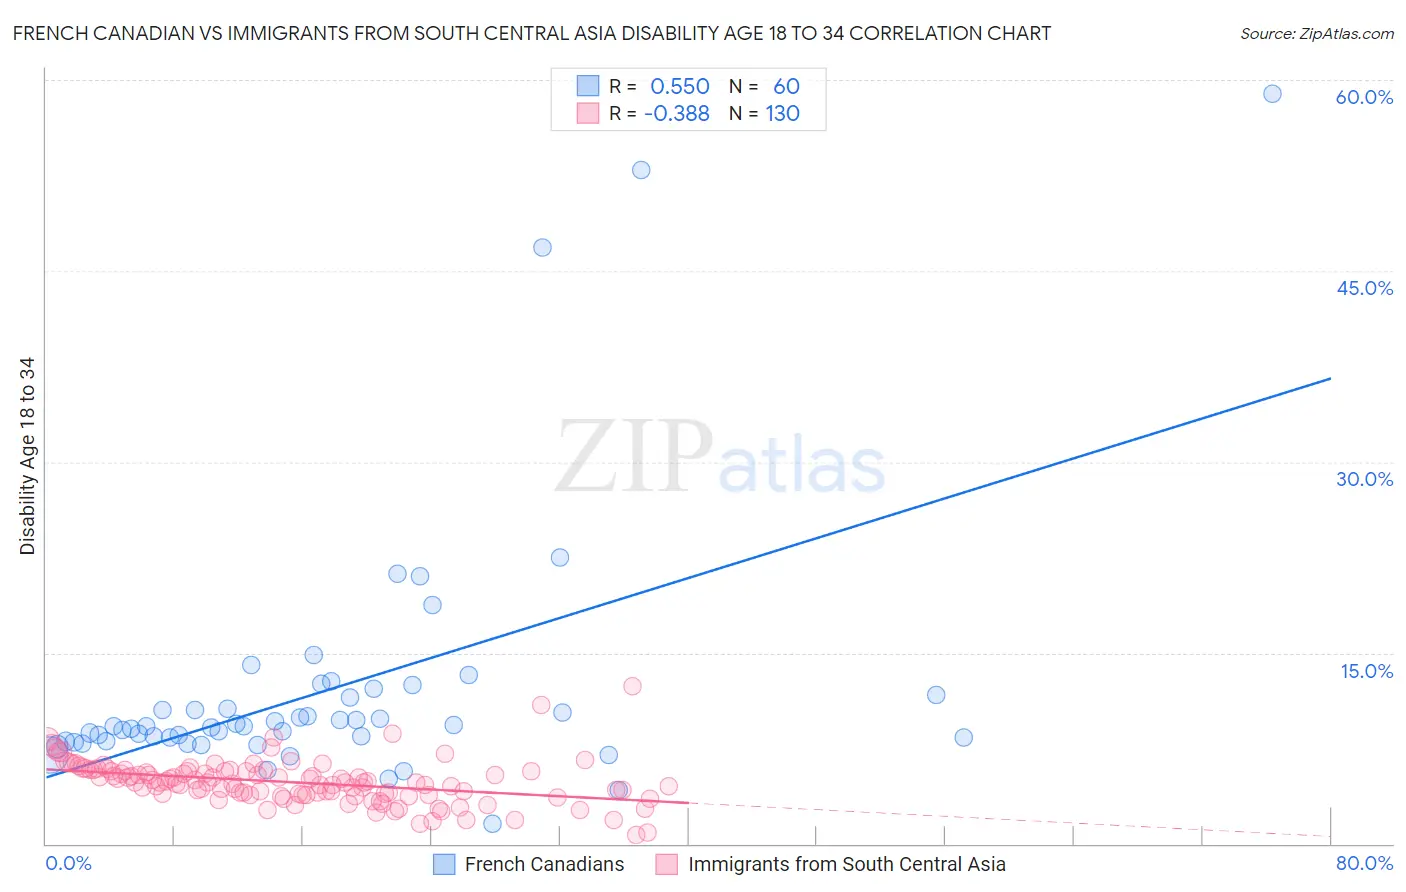
French Canadian vs Immigrants from South Central Asia Disability Age 18 to 34 Correlation Chart
The statistical analysis conducted on geographies consisting of 499,728,064 people shows a substantial positive correlation between the proportion of French Canadians and percentage of population with a disability between the ages 18 and 35 in the United States with a correlation coefficient (R) of 0.550 and weighted average of 8.1%. Similarly, the statistical analysis conducted on geographies consisting of 471,740,318 people shows a mild negative correlation between the proportion of Immigrants from South Central Asia and percentage of population with a disability between the ages 18 and 35 in the United States with a correlation coefficient (R) of -0.388 and weighted average of 5.7%, a difference of 42.6%.
Disability Age 18 to 34 Correlation Summary
| Measurement | French Canadian | Immigrants from South Central Asia |
| Minimum | 1.6% | 0.66% |
| Maximum | 58.9% | 12.3% |
| Range | 57.3% | 11.7% |
| Mean | 12.1% | 4.8% |
| Median | 9.2% | 4.8% |
| Interquartile 25% (IQ1) | 8.1% | 3.8% |
| Interquartile 75% (IQ3) | 11.6% | 5.7% |
| Interquartile Range (IQR) | 3.5% | 1.9% |
| Standard Deviation (Sample) | 10.2% | 1.7% |
| Standard Deviation (Population) | 10.1% | 1.7% |
Similar Demographics by Disability Age 18 to 34
Demographics Similar to French Canadians by Disability Age 18 to 34
In terms of disability age 18 to 34, the demographic groups most similar to French Canadians are Aleut (8.1%, a difference of 0.040%), Navajo (8.1%, a difference of 0.090%), Hmong (8.1%, a difference of 0.42%), Blackfeet (8.1%, a difference of 0.45%), and Cree (8.1%, a difference of 0.51%).
| Demographics | Rating | Rank | Disability Age 18 to 34 |
| French | 0.0 /100 | #311 | Tragic 7.9% |
| Spanish Americans | 0.0 /100 | #312 | Tragic 7.9% |
| Iroquois | 0.0 /100 | #313 | Tragic 7.9% |
| Colville | 0.0 /100 | #314 | Tragic 7.9% |
| Americans | 0.0 /100 | #315 | Tragic 8.0% |
| Puerto Ricans | 0.0 /100 | #316 | Tragic 8.0% |
| Hmong | 0.0 /100 | #317 | Tragic 8.1% |
| French Canadians | 0.0 /100 | #318 | Tragic 8.1% |
| Aleuts | 0.0 /100 | #319 | Tragic 8.1% |
| Navajo | 0.0 /100 | #320 | Tragic 8.1% |
| Blackfeet | 0.0 /100 | #321 | Tragic 8.1% |
| Cree | 0.0 /100 | #322 | Tragic 8.1% |
| French American Indians | 0.0 /100 | #323 | Tragic 8.2% |
| Cajuns | 0.0 /100 | #324 | Tragic 8.2% |
| Natives/Alaskans | 0.0 /100 | #325 | Tragic 8.2% |
Demographics Similar to Immigrants from South Central Asia by Disability Age 18 to 34
In terms of disability age 18 to 34, the demographic groups most similar to Immigrants from South Central Asia are Immigrants from Nicaragua (5.7%, a difference of 0.070%), Immigrants from Bangladesh (5.6%, a difference of 0.58%), Cuban (5.7%, a difference of 0.67%), Thai (5.6%, a difference of 0.74%), and Immigrants from Argentina (5.7%, a difference of 0.78%).
| Demographics | Rating | Rank | Disability Age 18 to 34 |
| Indians (Asian) | 100.0 /100 | #14 | Exceptional 5.5% |
| Immigrants | India | 100.0 /100 | #15 | Exceptional 5.6% |
| Immigrants | Israel | 100.0 /100 | #16 | Exceptional 5.6% |
| Immigrants | Eastern Asia | 100.0 /100 | #17 | Exceptional 5.6% |
| Immigrants | Bolivia | 100.0 /100 | #18 | Exceptional 5.6% |
| Thais | 100.0 /100 | #19 | Exceptional 5.6% |
| Immigrants | Bangladesh | 100.0 /100 | #20 | Exceptional 5.6% |
| Immigrants | South Central Asia | 100.0 /100 | #21 | Exceptional 5.7% |
| Immigrants | Nicaragua | 100.0 /100 | #22 | Exceptional 5.7% |
| Cubans | 100.0 /100 | #23 | Exceptional 5.7% |
| Immigrants | Argentina | 100.0 /100 | #24 | Exceptional 5.7% |
| Immigrants | Singapore | 100.0 /100 | #25 | Exceptional 5.7% |
| Immigrants | Colombia | 100.0 /100 | #26 | Exceptional 5.7% |
| Immigrants | Venezuela | 99.9 /100 | #27 | Exceptional 5.7% |
| Soviet Union | 99.9 /100 | #28 | Exceptional 5.7% |