Belizean vs Immigrants from South Central Asia Disability Age 18 to 34
COMPARE
Belizean
Immigrants from South Central Asia
Disability Age 18 to 34
Disability Age 18 to 34 Comparison
Belizeans
Immigrants from South Central Asia
6.4%
DISABILITY AGE 18 TO 34
84.9/ 100
METRIC RATING
146th/ 347
METRIC RANK
5.7%
DISABILITY AGE 18 TO 34
100.0/ 100
METRIC RATING
21st/ 347
METRIC RANK
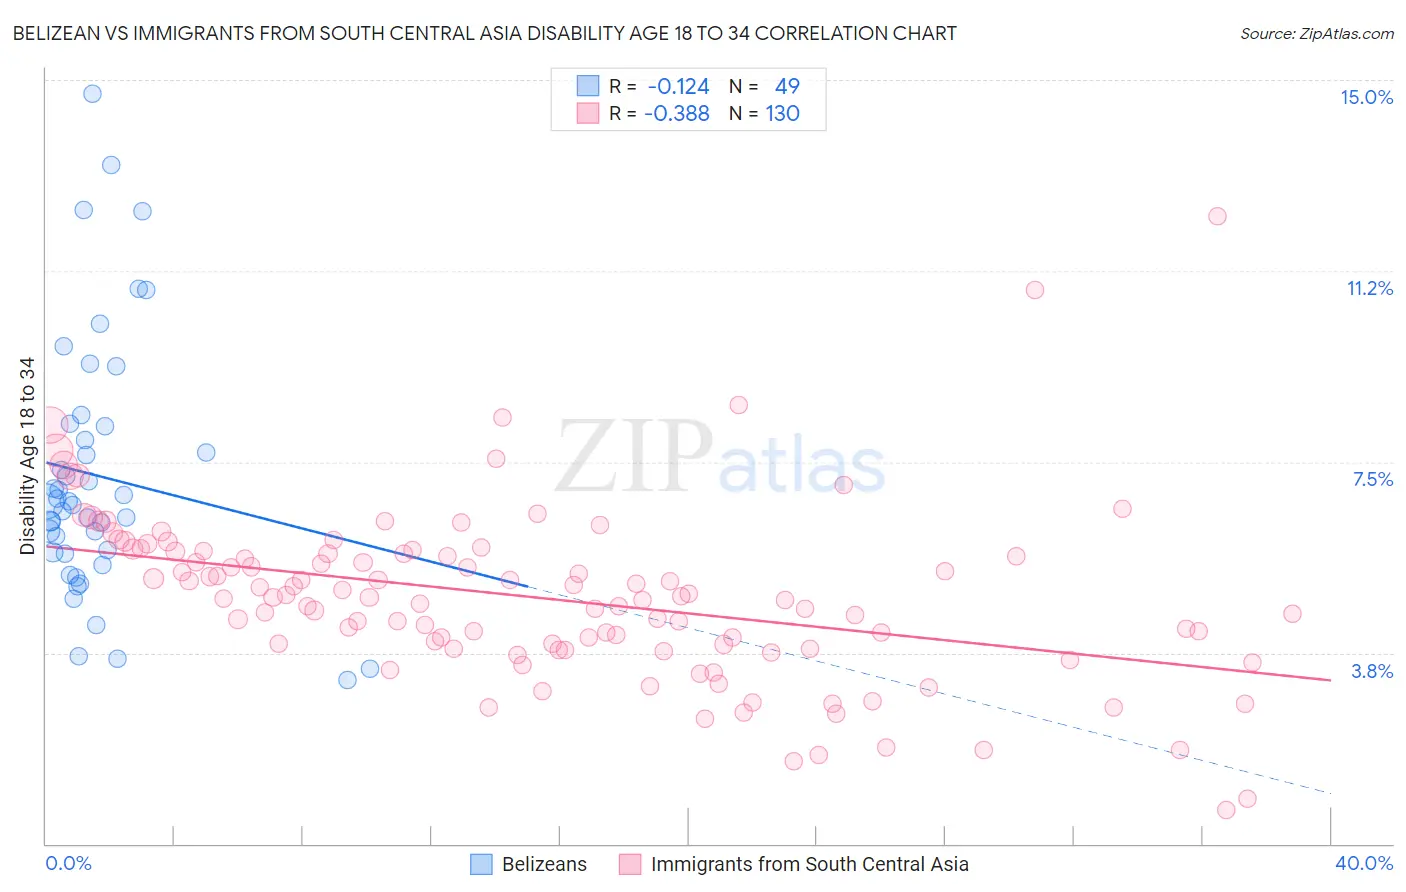
Belizean vs Immigrants from South Central Asia Disability Age 18 to 34 Correlation Chart
The statistical analysis conducted on geographies consisting of 144,092,857 people shows a poor negative correlation between the proportion of Belizeans and percentage of population with a disability between the ages 18 and 35 in the United States with a correlation coefficient (R) of -0.124 and weighted average of 6.4%. Similarly, the statistical analysis conducted on geographies consisting of 471,740,318 people shows a mild negative correlation between the proportion of Immigrants from South Central Asia and percentage of population with a disability between the ages 18 and 35 in the United States with a correlation coefficient (R) of -0.388 and weighted average of 5.7%, a difference of 12.9%.
Disability Age 18 to 34 Correlation Summary
| Measurement | Belizean | Immigrants from South Central Asia |
| Minimum | 3.2% | 0.66% |
| Maximum | 14.7% | 12.3% |
| Range | 11.5% | 11.7% |
| Mean | 7.2% | 4.8% |
| Median | 6.7% | 4.8% |
| Interquartile 25% (IQ1) | 5.7% | 3.8% |
| Interquartile 75% (IQ3) | 8.2% | 5.7% |
| Interquartile Range (IQR) | 2.5% | 1.9% |
| Standard Deviation (Sample) | 2.5% | 1.7% |
| Standard Deviation (Population) | 2.5% | 1.7% |
Similar Demographics by Disability Age 18 to 34
Demographics Similar to Belizeans by Disability Age 18 to 34
In terms of disability age 18 to 34, the demographic groups most similar to Belizeans are Moroccan (6.4%, a difference of 0.050%), Albanian (6.4%, a difference of 0.060%), Immigrants from South Africa (6.4%, a difference of 0.16%), Immigrants from Belgium (6.4%, a difference of 0.18%), and Immigrants from Latvia (6.4%, a difference of 0.23%).
| Demographics | Rating | Rank | Disability Age 18 to 34 |
| Immigrants | Belize | 87.4 /100 | #139 | Excellent 6.4% |
| Immigrants | Fiji | 87.3 /100 | #140 | Excellent 6.4% |
| Jamaicans | 86.8 /100 | #141 | Excellent 6.4% |
| South American Indians | 86.5 /100 | #142 | Excellent 6.4% |
| Immigrants | Latvia | 86.4 /100 | #143 | Excellent 6.4% |
| Albanians | 85.3 /100 | #144 | Excellent 6.4% |
| Moroccans | 85.2 /100 | #145 | Excellent 6.4% |
| Belizeans | 84.9 /100 | #146 | Excellent 6.4% |
| Immigrants | South Africa | 83.7 /100 | #147 | Excellent 6.4% |
| Immigrants | Belgium | 83.5 /100 | #148 | Excellent 6.4% |
| Hondurans | 83.1 /100 | #149 | Excellent 6.4% |
| Immigrants | Dominican Republic | 82.7 /100 | #150 | Excellent 6.4% |
| Tongans | 81.9 /100 | #151 | Excellent 6.4% |
| Bulgarians | 78.3 /100 | #152 | Good 6.5% |
| Immigrants | Eritrea | 77.4 /100 | #153 | Good 6.5% |
Demographics Similar to Immigrants from South Central Asia by Disability Age 18 to 34
In terms of disability age 18 to 34, the demographic groups most similar to Immigrants from South Central Asia are Immigrants from Nicaragua (5.7%, a difference of 0.070%), Immigrants from Bangladesh (5.6%, a difference of 0.58%), Cuban (5.7%, a difference of 0.67%), Thai (5.6%, a difference of 0.74%), and Immigrants from Argentina (5.7%, a difference of 0.78%).
| Demographics | Rating | Rank | Disability Age 18 to 34 |
| Indians (Asian) | 100.0 /100 | #14 | Exceptional 5.5% |
| Immigrants | India | 100.0 /100 | #15 | Exceptional 5.6% |
| Immigrants | Israel | 100.0 /100 | #16 | Exceptional 5.6% |
| Immigrants | Eastern Asia | 100.0 /100 | #17 | Exceptional 5.6% |
| Immigrants | Bolivia | 100.0 /100 | #18 | Exceptional 5.6% |
| Thais | 100.0 /100 | #19 | Exceptional 5.6% |
| Immigrants | Bangladesh | 100.0 /100 | #20 | Exceptional 5.6% |
| Immigrants | South Central Asia | 100.0 /100 | #21 | Exceptional 5.7% |
| Immigrants | Nicaragua | 100.0 /100 | #22 | Exceptional 5.7% |
| Cubans | 100.0 /100 | #23 | Exceptional 5.7% |
| Immigrants | Argentina | 100.0 /100 | #24 | Exceptional 5.7% |
| Immigrants | Singapore | 100.0 /100 | #25 | Exceptional 5.7% |
| Immigrants | Colombia | 100.0 /100 | #26 | Exceptional 5.7% |
| Immigrants | Venezuela | 99.9 /100 | #27 | Exceptional 5.7% |
| Soviet Union | 99.9 /100 | #28 | Exceptional 5.7% |