French American Indian vs Immigrants from Iraq Disability Age Over 75
COMPARE
French American Indian
Immigrants from Iraq
Disability Age Over 75
Disability Age Over 75 Comparison
French American Indians
Immigrants from Iraq
48.3%
DISABILITY AGE OVER 75
2.2/ 100
METRIC RATING
242nd/ 347
METRIC RANK
49.1%
DISABILITY AGE OVER 75
0.1/ 100
METRIC RATING
273rd/ 347
METRIC RANK
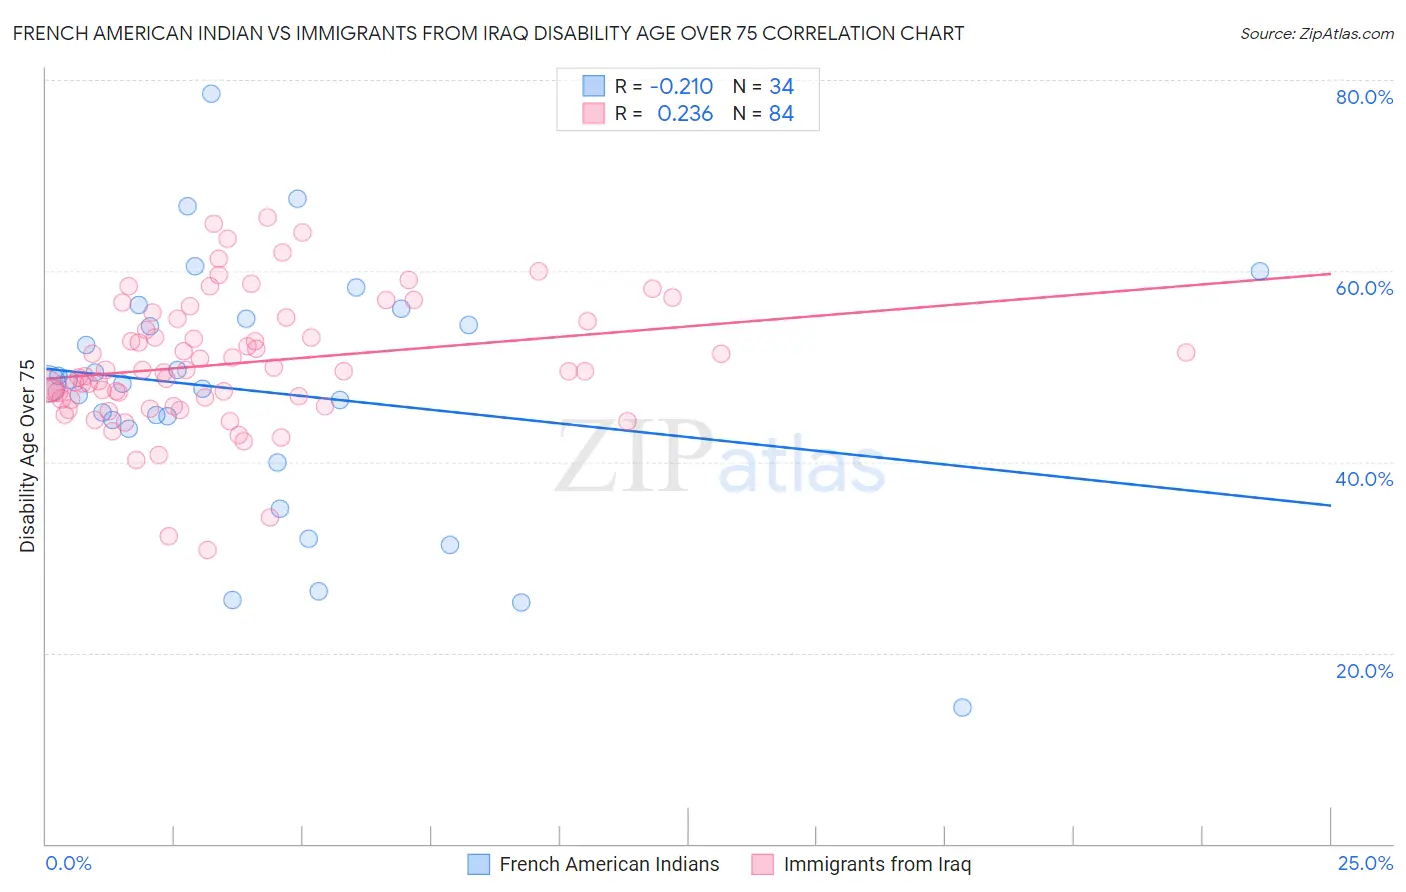
French American Indian vs Immigrants from Iraq Disability Age Over 75 Correlation Chart
The statistical analysis conducted on geographies consisting of 131,956,018 people shows a weak negative correlation between the proportion of French American Indians and percentage of population with a disability over the age of 75 in the United States with a correlation coefficient (R) of -0.210 and weighted average of 48.3%. Similarly, the statistical analysis conducted on geographies consisting of 194,692,045 people shows a weak positive correlation between the proportion of Immigrants from Iraq and percentage of population with a disability over the age of 75 in the United States with a correlation coefficient (R) of 0.236 and weighted average of 49.1%, a difference of 1.5%.
Disability Age Over 75 Correlation Summary
| Measurement | French American Indian | Immigrants from Iraq |
| Minimum | 14.3% | 30.8% |
| Maximum | 78.6% | 65.6% |
| Range | 64.3% | 34.8% |
| Mean | 47.3% | 50.3% |
| Median | 48.2% | 49.5% |
| Interquartile 25% (IQ1) | 43.4% | 46.6% |
| Interquartile 75% (IQ3) | 55.0% | 54.9% |
| Interquartile Range (IQR) | 11.6% | 8.3% |
| Standard Deviation (Sample) | 13.3% | 6.8% |
| Standard Deviation (Population) | 13.1% | 6.7% |
Similar Demographics by Disability Age Over 75
Demographics Similar to French American Indians by Disability Age Over 75
In terms of disability age over 75, the demographic groups most similar to French American Indians are Native Hawaiian (48.3%, a difference of 0.0%), Tongan (48.3%, a difference of 0.010%), Immigrants from Caribbean (48.4%, a difference of 0.040%), Immigrants from Thailand (48.3%, a difference of 0.12%), and Afghan (48.4%, a difference of 0.13%).
| Demographics | Rating | Rank | Disability Age Over 75 |
| Hmong | 3.8 /100 | #235 | Tragic 48.2% |
| Immigrants | Nicaragua | 3.2 /100 | #236 | Tragic 48.2% |
| Immigrants | St. Vincent and the Grenadines | 3.2 /100 | #237 | Tragic 48.2% |
| Nicaraguans | 3.0 /100 | #238 | Tragic 48.3% |
| Immigrants | Thailand | 2.8 /100 | #239 | Tragic 48.3% |
| Tongans | 2.3 /100 | #240 | Tragic 48.3% |
| Native Hawaiians | 2.2 /100 | #241 | Tragic 48.3% |
| French American Indians | 2.2 /100 | #242 | Tragic 48.3% |
| Immigrants | Caribbean | 2.1 /100 | #243 | Tragic 48.4% |
| Afghans | 1.8 /100 | #244 | Tragic 48.4% |
| Americans | 1.7 /100 | #245 | Tragic 48.4% |
| Chippewa | 1.6 /100 | #246 | Tragic 48.4% |
| Iroquois | 1.6 /100 | #247 | Tragic 48.4% |
| Sri Lankans | 1.4 /100 | #248 | Tragic 48.5% |
| Iraqis | 1.0 /100 | #249 | Tragic 48.6% |
Demographics Similar to Immigrants from Iraq by Disability Age Over 75
In terms of disability age over 75, the demographic groups most similar to Immigrants from Iraq are Assyrian/Chaldean/Syriac (49.1%, a difference of 0.050%), Fijian (49.0%, a difference of 0.060%), Immigrants from Guatemala (49.1%, a difference of 0.070%), Immigrants from Dominica (49.1%, a difference of 0.080%), and Potawatomi (49.0%, a difference of 0.090%).
| Demographics | Rating | Rank | Disability Age Over 75 |
| U.S. Virgin Islanders | 0.2 /100 | #266 | Tragic 48.9% |
| Malaysians | 0.2 /100 | #267 | Tragic 49.0% |
| Guatemalans | 0.2 /100 | #268 | Tragic 49.0% |
| Immigrants | El Salvador | 0.2 /100 | #269 | Tragic 49.0% |
| Potawatomi | 0.2 /100 | #270 | Tragic 49.0% |
| Fijians | 0.2 /100 | #271 | Tragic 49.0% |
| Assyrians/Chaldeans/Syriacs | 0.2 /100 | #272 | Tragic 49.1% |
| Immigrants | Iraq | 0.1 /100 | #273 | Tragic 49.1% |
| Immigrants | Guatemala | 0.1 /100 | #274 | Tragic 49.1% |
| Immigrants | Dominica | 0.1 /100 | #275 | Tragic 49.1% |
| Immigrants | Uzbekistan | 0.1 /100 | #276 | Tragic 49.2% |
| Hawaiians | 0.1 /100 | #277 | Tragic 49.2% |
| Immigrants | Laos | 0.1 /100 | #278 | Tragic 49.2% |
| Guamanians/Chamorros | 0.0 /100 | #279 | Tragic 49.4% |
| Bangladeshis | 0.0 /100 | #280 | Tragic 49.4% |