Belizean vs Immigrants from Iraq Disability Age Over 75
COMPARE
Belizean
Immigrants from Iraq
Disability Age Over 75
Disability Age Over 75 Comparison
Belizeans
Immigrants from Iraq
49.4%
DISABILITY AGE OVER 75
0.0/ 100
METRIC RATING
281st/ 347
METRIC RANK
49.1%
DISABILITY AGE OVER 75
0.1/ 100
METRIC RATING
273rd/ 347
METRIC RANK
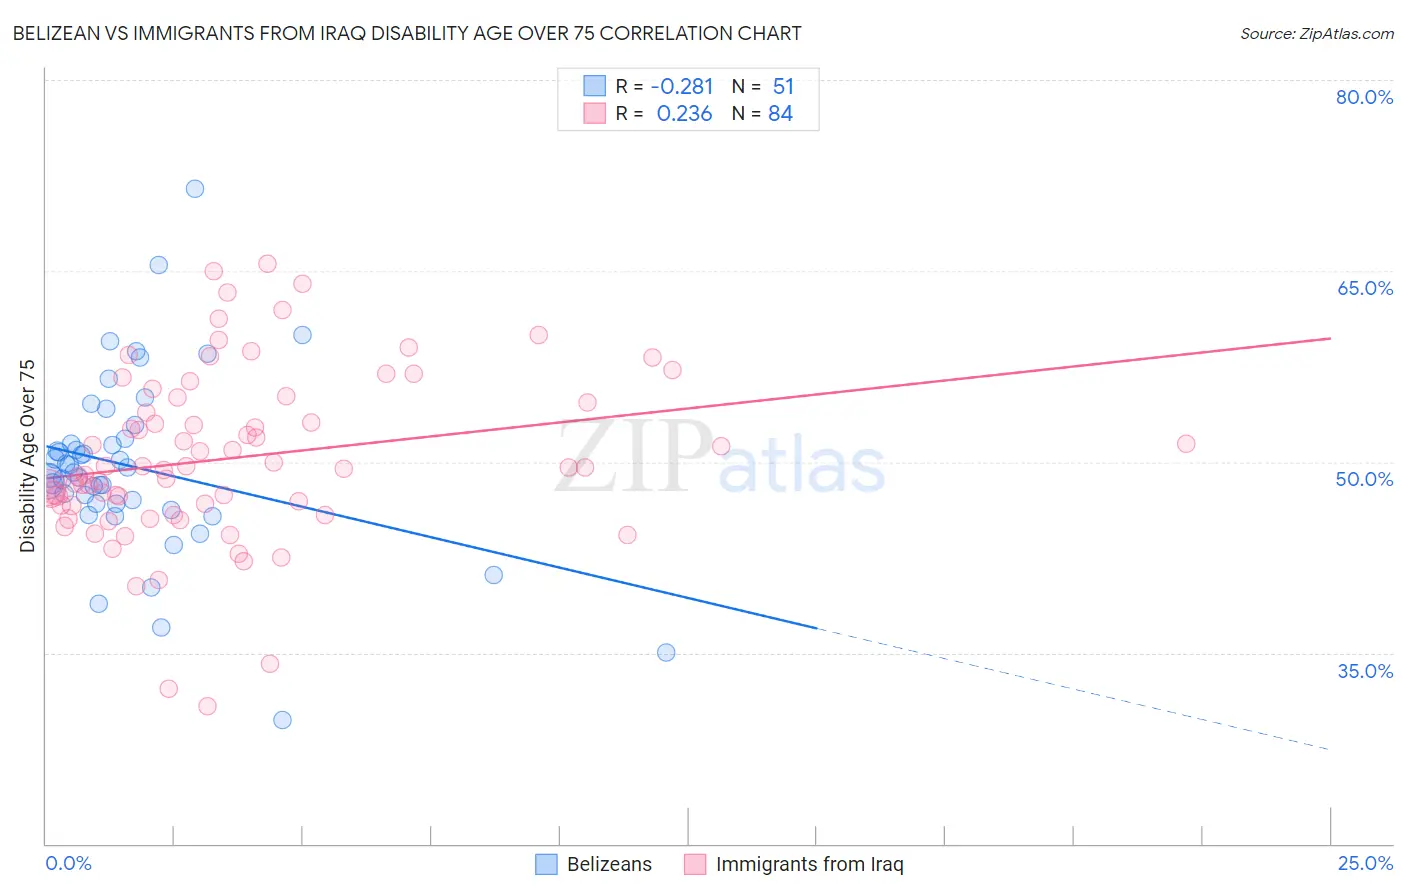
Belizean vs Immigrants from Iraq Disability Age Over 75 Correlation Chart
The statistical analysis conducted on geographies consisting of 144,100,145 people shows a weak negative correlation between the proportion of Belizeans and percentage of population with a disability over the age of 75 in the United States with a correlation coefficient (R) of -0.281 and weighted average of 49.4%. Similarly, the statistical analysis conducted on geographies consisting of 194,692,045 people shows a weak positive correlation between the proportion of Immigrants from Iraq and percentage of population with a disability over the age of 75 in the United States with a correlation coefficient (R) of 0.236 and weighted average of 49.1%, a difference of 0.71%.
Disability Age Over 75 Correlation Summary
| Measurement | Belizean | Immigrants from Iraq |
| Minimum | 29.7% | 30.8% |
| Maximum | 71.4% | 65.6% |
| Range | 41.7% | 34.8% |
| Mean | 49.6% | 50.3% |
| Median | 49.1% | 49.5% |
| Interquartile 25% (IQ1) | 46.7% | 46.6% |
| Interquartile 75% (IQ3) | 51.8% | 54.9% |
| Interquartile Range (IQR) | 5.1% | 8.3% |
| Standard Deviation (Sample) | 7.1% | 6.8% |
| Standard Deviation (Population) | 7.0% | 6.7% |
Demographics Similar to Belizeans and Immigrants from Iraq by Disability Age Over 75
In terms of disability age over 75, the demographic groups most similar to Belizeans are Bangladeshi (49.4%, a difference of 0.0%), Guamanian/Chamorro (49.4%, a difference of 0.070%), Black/African American (49.5%, a difference of 0.14%), Samoan (49.5%, a difference of 0.17%), and Immigrants from Latin America (49.5%, a difference of 0.22%). Similarly, the demographic groups most similar to Immigrants from Iraq are Assyrian/Chaldean/Syriac (49.1%, a difference of 0.050%), Fijian (49.0%, a difference of 0.060%), Immigrants from Guatemala (49.1%, a difference of 0.070%), Immigrants from Dominica (49.1%, a difference of 0.080%), and Potawatomi (49.0%, a difference of 0.090%).
| Demographics | Rating | Rank | Disability Age Over 75 |
| Malaysians | 0.2 /100 | #267 | Tragic 49.0% |
| Guatemalans | 0.2 /100 | #268 | Tragic 49.0% |
| Immigrants | El Salvador | 0.2 /100 | #269 | Tragic 49.0% |
| Potawatomi | 0.2 /100 | #270 | Tragic 49.0% |
| Fijians | 0.2 /100 | #271 | Tragic 49.0% |
| Assyrians/Chaldeans/Syriacs | 0.2 /100 | #272 | Tragic 49.1% |
| Immigrants | Iraq | 0.1 /100 | #273 | Tragic 49.1% |
| Immigrants | Guatemala | 0.1 /100 | #274 | Tragic 49.1% |
| Immigrants | Dominica | 0.1 /100 | #275 | Tragic 49.1% |
| Immigrants | Uzbekistan | 0.1 /100 | #276 | Tragic 49.2% |
| Hawaiians | 0.1 /100 | #277 | Tragic 49.2% |
| Immigrants | Laos | 0.1 /100 | #278 | Tragic 49.2% |
| Guamanians/Chamorros | 0.0 /100 | #279 | Tragic 49.4% |
| Bangladeshis | 0.0 /100 | #280 | Tragic 49.4% |
| Belizeans | 0.0 /100 | #281 | Tragic 49.4% |
| Blacks/African Americans | 0.0 /100 | #282 | Tragic 49.5% |
| Samoans | 0.0 /100 | #283 | Tragic 49.5% |
| Immigrants | Latin America | 0.0 /100 | #284 | Tragic 49.5% |
| Crow | 0.0 /100 | #285 | Tragic 49.6% |
| Immigrants | Belize | 0.0 /100 | #286 | Tragic 49.6% |
| Sioux | 0.0 /100 | #287 | Tragic 49.7% |