Finnish vs Russian Vision Disability
COMPARE
Finnish
Russian
Vision Disability
Vision Disability Comparison
Finns
Russians
2.1%
VISION DISABILITY
78.3/ 100
METRIC RATING
148th/ 347
METRIC RANK
2.0%
VISION DISABILITY
98.6/ 100
METRIC RATING
69th/ 347
METRIC RANK
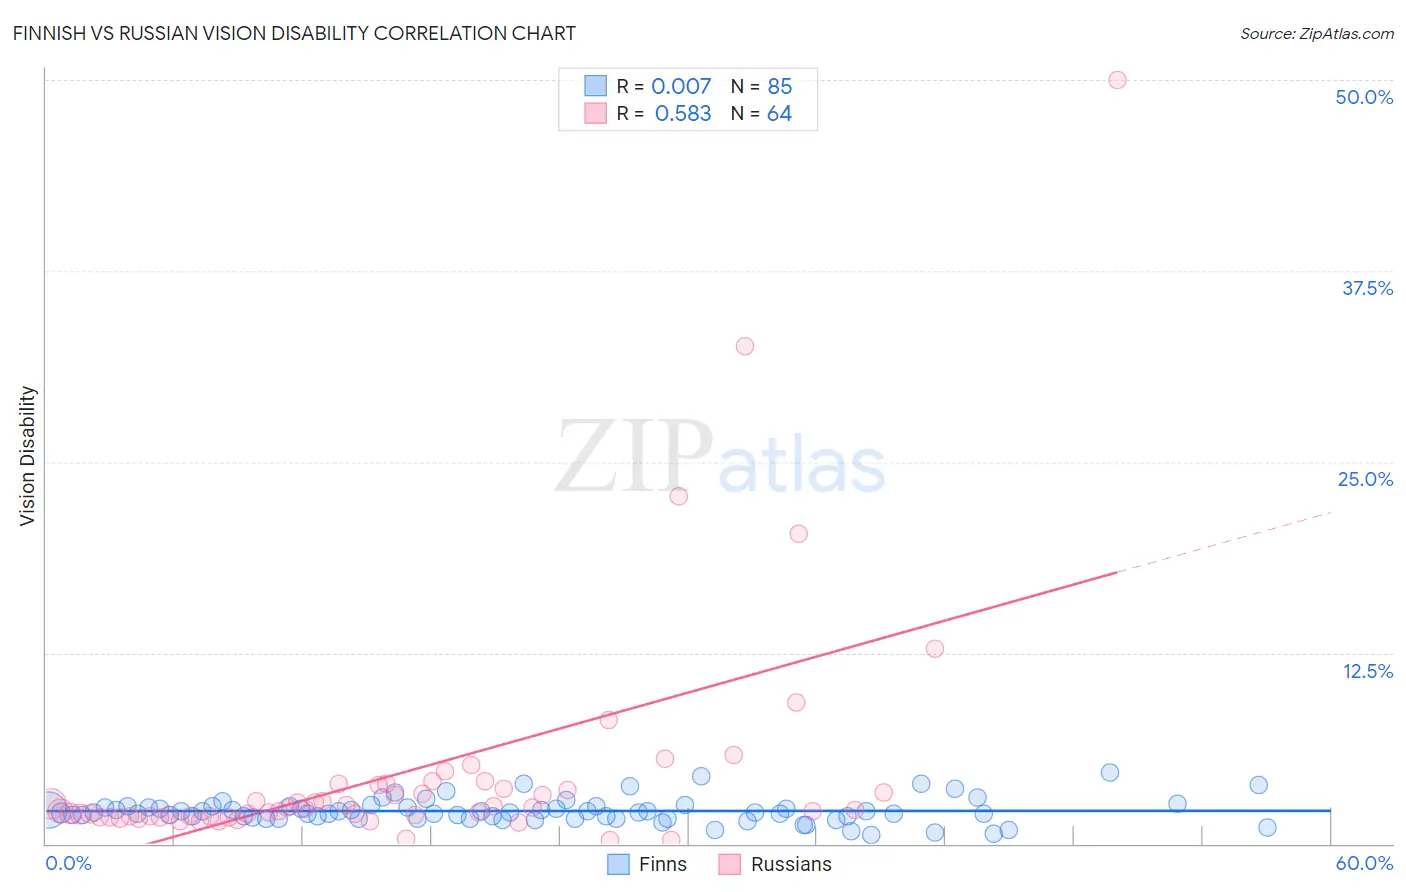
Finnish vs Russian Vision Disability Correlation Chart
The statistical analysis conducted on geographies consisting of 404,250,677 people shows no correlation between the proportion of Finns and percentage of population with vision disability in the United States with a correlation coefficient (R) of 0.007 and weighted average of 2.1%. Similarly, the statistical analysis conducted on geographies consisting of 511,148,193 people shows a substantial positive correlation between the proportion of Russians and percentage of population with vision disability in the United States with a correlation coefficient (R) of 0.583 and weighted average of 2.0%, a difference of 5.0%.
Vision Disability Correlation Summary
| Measurement | Finnish | Russian |
| Minimum | 0.59% | 0.22% |
| Maximum | 4.6% | 50.0% |
| Range | 4.0% | 49.8% |
| Mean | 2.1% | 4.6% |
| Median | 2.1% | 2.2% |
| Interquartile 25% (IQ1) | 1.7% | 1.8% |
| Interquartile 75% (IQ3) | 2.4% | 3.7% |
| Interquartile Range (IQR) | 0.76% | 1.9% |
| Standard Deviation (Sample) | 0.79% | 7.8% |
| Standard Deviation (Population) | 0.79% | 7.8% |
Similar Demographics by Vision Disability
Demographics Similar to Finns by Vision Disability
In terms of vision disability, the demographic groups most similar to Finns are Immigrants from Sudan (2.1%, a difference of 0.010%), Italian (2.1%, a difference of 0.14%), Colombian (2.1%, a difference of 0.19%), Belgian (2.1%, a difference of 0.22%), and Immigrants from Norway (2.1%, a difference of 0.25%).
| Demographics | Rating | Rank | Vision Disability |
| Sierra Leoneans | 84.1 /100 | #141 | Excellent 2.1% |
| South Americans | 82.8 /100 | #142 | Excellent 2.1% |
| Immigrants | Sierra Leone | 82.8 /100 | #143 | Excellent 2.1% |
| Ukrainians | 81.9 /100 | #144 | Excellent 2.1% |
| Immigrants | Bosnia and Herzegovina | 81.5 /100 | #145 | Excellent 2.1% |
| Italians | 79.7 /100 | #146 | Good 2.1% |
| Immigrants | Sudan | 78.4 /100 | #147 | Good 2.1% |
| Finns | 78.3 /100 | #148 | Good 2.1% |
| Colombians | 76.2 /100 | #149 | Good 2.1% |
| Belgians | 75.9 /100 | #150 | Good 2.1% |
| Immigrants | Norway | 75.5 /100 | #151 | Good 2.1% |
| Immigrants | Southern Europe | 74.6 /100 | #152 | Good 2.1% |
| Immigrants | South America | 73.8 /100 | #153 | Good 2.1% |
| Slovenes | 73.6 /100 | #154 | Good 2.1% |
| Immigrants | Colombia | 72.1 /100 | #155 | Good 2.1% |
Demographics Similar to Russians by Vision Disability
In terms of vision disability, the demographic groups most similar to Russians are Immigrants from Kazakhstan (2.0%, a difference of 0.020%), Immigrants from Northern Europe (2.0%, a difference of 0.030%), Immigrants from France (2.0%, a difference of 0.080%), Immigrants from Czechoslovakia (2.0%, a difference of 0.17%), and Immigrants from Northern Africa (2.0%, a difference of 0.27%).
| Demographics | Rating | Rank | Vision Disability |
| Immigrants | Russia | 99.1 /100 | #62 | Exceptional 2.0% |
| Armenians | 99.0 /100 | #63 | Exceptional 2.0% |
| Immigrants | Greece | 99.0 /100 | #64 | Exceptional 2.0% |
| Maltese | 98.9 /100 | #65 | Exceptional 2.0% |
| Immigrants | Argentina | 98.9 /100 | #66 | Exceptional 2.0% |
| Immigrants | Northern Africa | 98.8 /100 | #67 | Exceptional 2.0% |
| Immigrants | Czechoslovakia | 98.7 /100 | #68 | Exceptional 2.0% |
| Russians | 98.6 /100 | #69 | Exceptional 2.0% |
| Immigrants | Kazakhstan | 98.6 /100 | #70 | Exceptional 2.0% |
| Immigrants | Northern Europe | 98.6 /100 | #71 | Exceptional 2.0% |
| Immigrants | France | 98.5 /100 | #72 | Exceptional 2.0% |
| Immigrants | Eritrea | 98.4 /100 | #73 | Exceptional 2.0% |
| Palestinians | 98.3 /100 | #74 | Exceptional 2.0% |
| Immigrants | North Macedonia | 98.3 /100 | #75 | Exceptional 2.0% |
| Paraguayans | 98.3 /100 | #76 | Exceptional 2.0% |