Finnish vs Mexican Vision Disability
COMPARE
Finnish
Mexican
Vision Disability
Vision Disability Comparison
Finns
Mexicans
2.1%
VISION DISABILITY
78.3/ 100
METRIC RATING
148th/ 347
METRIC RANK
2.5%
VISION DISABILITY
0.0/ 100
METRIC RATING
298th/ 347
METRIC RANK
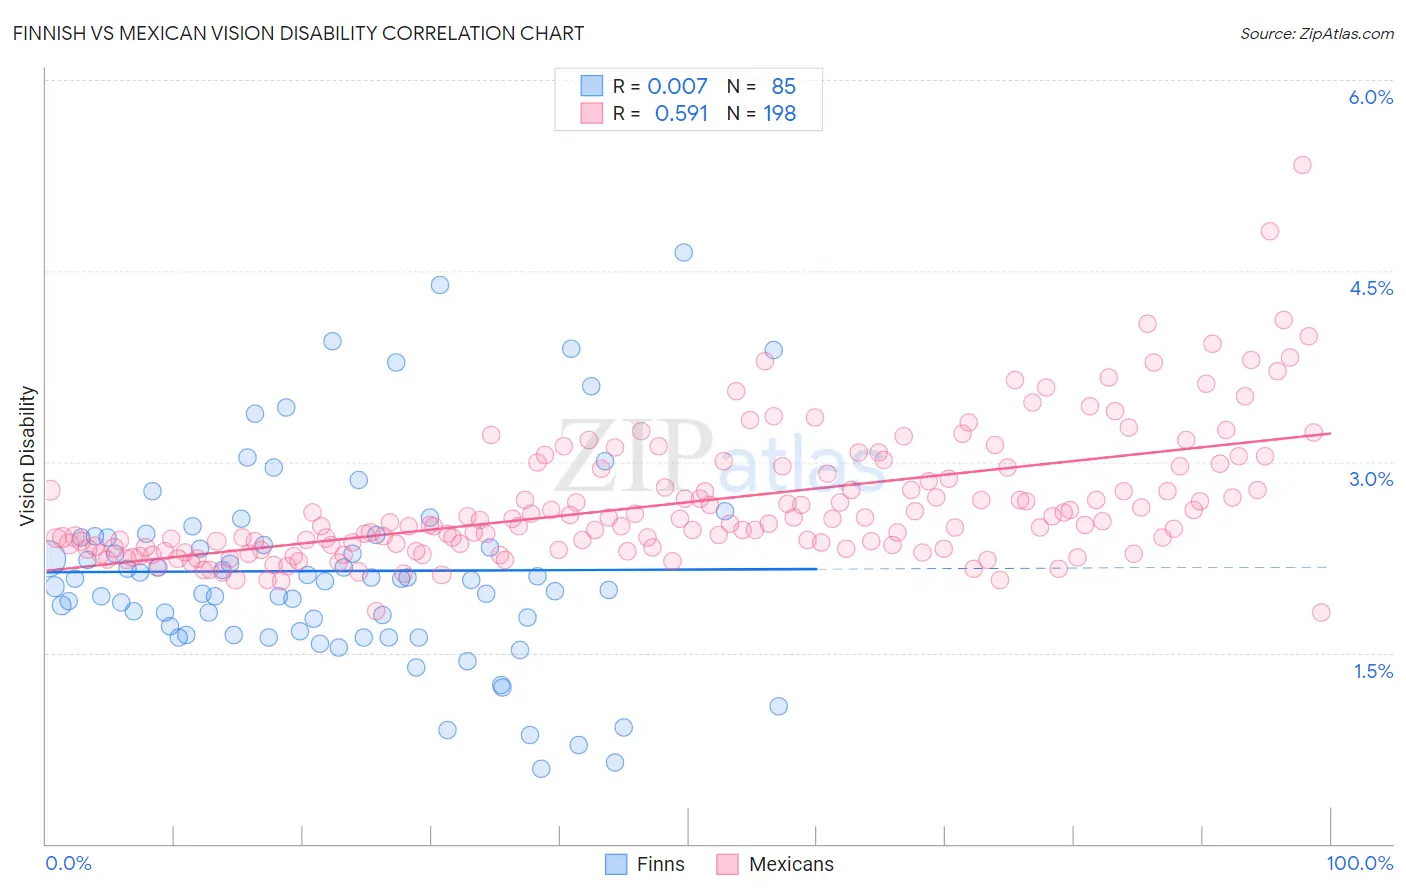
Finnish vs Mexican Vision Disability Correlation Chart
The statistical analysis conducted on geographies consisting of 404,250,677 people shows no correlation between the proportion of Finns and percentage of population with vision disability in the United States with a correlation coefficient (R) of 0.007 and weighted average of 2.1%. Similarly, the statistical analysis conducted on geographies consisting of 563,538,234 people shows a substantial positive correlation between the proportion of Mexicans and percentage of population with vision disability in the United States with a correlation coefficient (R) of 0.591 and weighted average of 2.5%, a difference of 19.3%.
Vision Disability Correlation Summary
| Measurement | Finnish | Mexican |
| Minimum | 0.59% | 1.8% |
| Maximum | 4.6% | 5.3% |
| Range | 4.0% | 3.5% |
| Mean | 2.1% | 2.7% |
| Median | 2.1% | 2.5% |
| Interquartile 25% (IQ1) | 1.7% | 2.3% |
| Interquartile 75% (IQ3) | 2.4% | 2.9% |
| Interquartile Range (IQR) | 0.76% | 0.62% |
| Standard Deviation (Sample) | 0.79% | 0.52% |
| Standard Deviation (Population) | 0.79% | 0.52% |
Similar Demographics by Vision Disability
Demographics Similar to Finns by Vision Disability
In terms of vision disability, the demographic groups most similar to Finns are Immigrants from Sudan (2.1%, a difference of 0.010%), Italian (2.1%, a difference of 0.14%), Colombian (2.1%, a difference of 0.19%), Belgian (2.1%, a difference of 0.22%), and Immigrants from Norway (2.1%, a difference of 0.25%).
| Demographics | Rating | Rank | Vision Disability |
| Sierra Leoneans | 84.1 /100 | #141 | Excellent 2.1% |
| South Americans | 82.8 /100 | #142 | Excellent 2.1% |
| Immigrants | Sierra Leone | 82.8 /100 | #143 | Excellent 2.1% |
| Ukrainians | 81.9 /100 | #144 | Excellent 2.1% |
| Immigrants | Bosnia and Herzegovina | 81.5 /100 | #145 | Excellent 2.1% |
| Italians | 79.7 /100 | #146 | Good 2.1% |
| Immigrants | Sudan | 78.4 /100 | #147 | Good 2.1% |
| Finns | 78.3 /100 | #148 | Good 2.1% |
| Colombians | 76.2 /100 | #149 | Good 2.1% |
| Belgians | 75.9 /100 | #150 | Good 2.1% |
| Immigrants | Norway | 75.5 /100 | #151 | Good 2.1% |
| Immigrants | Southern Europe | 74.6 /100 | #152 | Good 2.1% |
| Immigrants | South America | 73.8 /100 | #153 | Good 2.1% |
| Slovenes | 73.6 /100 | #154 | Good 2.1% |
| Immigrants | Colombia | 72.1 /100 | #155 | Good 2.1% |
Demographics Similar to Mexicans by Vision Disability
In terms of vision disability, the demographic groups most similar to Mexicans are Cree (2.5%, a difference of 0.040%), Immigrants from Dominica (2.5%, a difference of 0.14%), African (2.5%, a difference of 0.24%), Menominee (2.5%, a difference of 0.41%), and Immigrants from Mexico (2.5%, a difference of 0.82%).
| Demographics | Rating | Rank | Vision Disability |
| Immigrants | Honduras | 0.0 /100 | #291 | Tragic 2.5% |
| Crow | 0.0 /100 | #292 | Tragic 2.5% |
| Yaqui | 0.0 /100 | #293 | Tragic 2.5% |
| Ottawa | 0.0 /100 | #294 | Tragic 2.5% |
| Delaware | 0.0 /100 | #295 | Tragic 2.5% |
| Immigrants | Mexico | 0.0 /100 | #296 | Tragic 2.5% |
| Immigrants | Dominica | 0.0 /100 | #297 | Tragic 2.5% |
| Mexicans | 0.0 /100 | #298 | Tragic 2.5% |
| Cree | 0.0 /100 | #299 | Tragic 2.5% |
| Africans | 0.0 /100 | #300 | Tragic 2.5% |
| Menominee | 0.0 /100 | #301 | Tragic 2.5% |
| Spanish American Indians | 0.0 /100 | #302 | Tragic 2.6% |
| Immigrants | Cabo Verde | 0.0 /100 | #303 | Tragic 2.6% |
| Aleuts | 0.0 /100 | #304 | Tragic 2.6% |
| Hispanics or Latinos | 0.0 /100 | #305 | Tragic 2.6% |