Dominican vs Immigrants from Uganda Vision Disability
COMPARE
Dominican
Immigrants from Uganda
Vision Disability
Vision Disability Comparison
Dominicans
Immigrants from Uganda
2.6%
VISION DISABILITY
0.0/ 100
METRIC RATING
311th/ 347
METRIC RANK
2.1%
VISION DISABILITY
91.4/ 100
METRIC RATING
119th/ 347
METRIC RANK
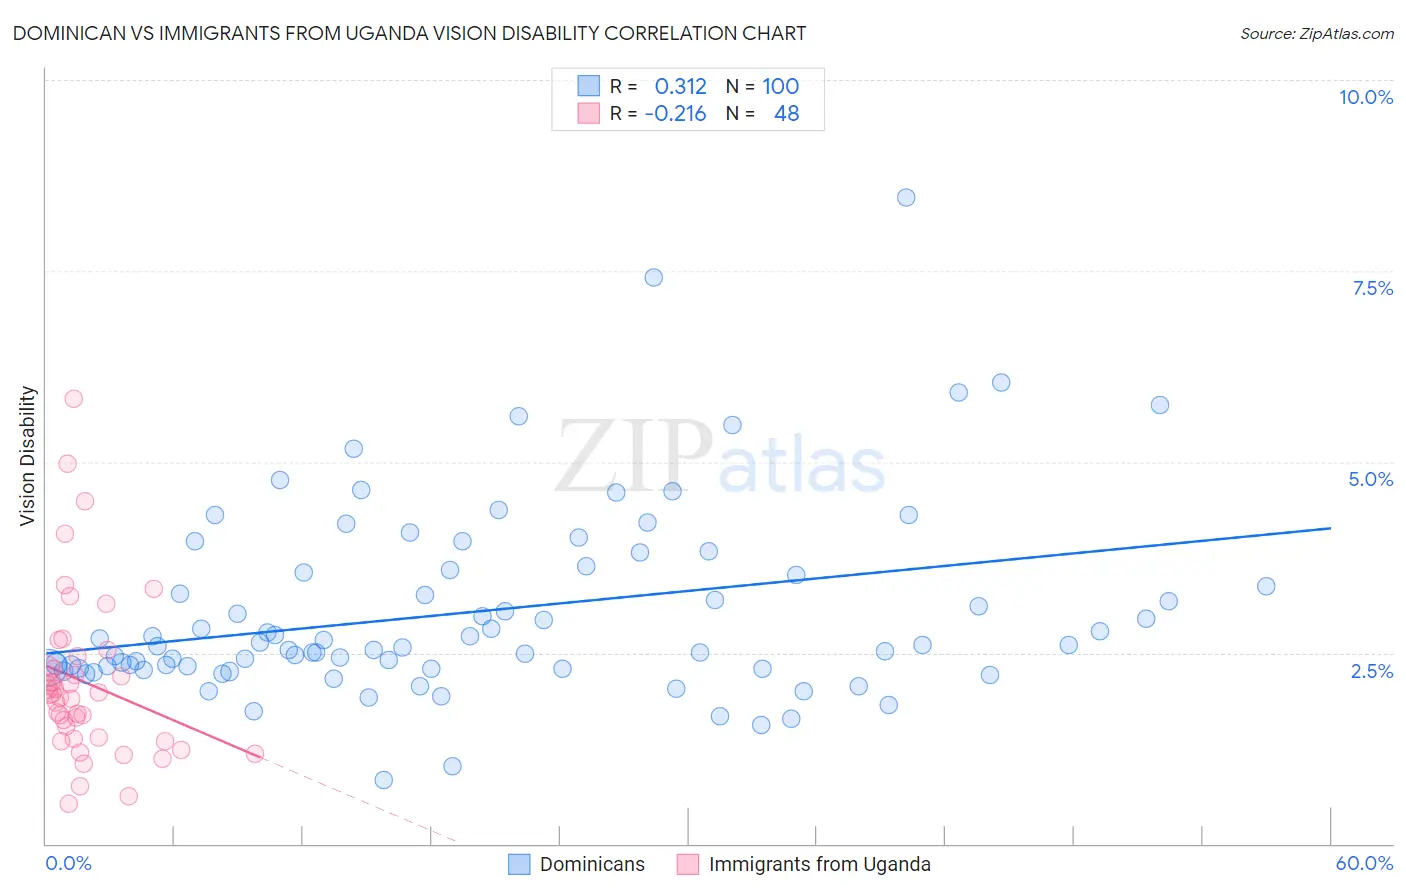
Dominican vs Immigrants from Uganda Vision Disability Correlation Chart
The statistical analysis conducted on geographies consisting of 354,764,822 people shows a mild positive correlation between the proportion of Dominicans and percentage of population with vision disability in the United States with a correlation coefficient (R) of 0.312 and weighted average of 2.6%. Similarly, the statistical analysis conducted on geographies consisting of 125,949,603 people shows a weak negative correlation between the proportion of Immigrants from Uganda and percentage of population with vision disability in the United States with a correlation coefficient (R) of -0.216 and weighted average of 2.1%, a difference of 25.9%.
Vision Disability Correlation Summary
| Measurement | Dominican | Immigrants from Uganda |
| Minimum | 0.84% | 0.52% |
| Maximum | 8.5% | 5.8% |
| Range | 7.6% | 5.3% |
| Mean | 3.0% | 2.1% |
| Median | 2.6% | 2.0% |
| Interquartile 25% (IQ1) | 2.3% | 1.4% |
| Interquartile 75% (IQ3) | 3.6% | 2.4% |
| Interquartile Range (IQR) | 1.3% | 0.99% |
| Standard Deviation (Sample) | 1.3% | 1.1% |
| Standard Deviation (Population) | 1.3% | 1.1% |
Similar Demographics by Vision Disability
Demographics Similar to Dominicans by Vision Disability
In terms of vision disability, the demographic groups most similar to Dominicans are Blackfeet (2.6%, a difference of 0.040%), Immigrants from Yemen (2.6%, a difference of 0.37%), Arapaho (2.6%, a difference of 0.65%), Immigrants from Dominican Republic (2.6%, a difference of 0.67%), and Iroquois (2.6%, a difference of 0.70%).
| Demographics | Rating | Rank | Vision Disability |
| Aleuts | 0.0 /100 | #304 | Tragic 2.6% |
| Hispanics or Latinos | 0.0 /100 | #305 | Tragic 2.6% |
| Iroquois | 0.0 /100 | #306 | Tragic 2.6% |
| Immigrants | Dominican Republic | 0.0 /100 | #307 | Tragic 2.6% |
| Arapaho | 0.0 /100 | #308 | Tragic 2.6% |
| Immigrants | Yemen | 0.0 /100 | #309 | Tragic 2.6% |
| Blackfeet | 0.0 /100 | #310 | Tragic 2.6% |
| Dominicans | 0.0 /100 | #311 | Tragic 2.6% |
| Americans | 0.0 /100 | #312 | Tragic 2.6% |
| Potawatomi | 0.0 /100 | #313 | Tragic 2.6% |
| Inupiat | 0.0 /100 | #314 | Tragic 2.7% |
| Osage | 0.0 /100 | #315 | Tragic 2.7% |
| Shoshone | 0.0 /100 | #316 | Tragic 2.7% |
| Yup'ik | 0.0 /100 | #317 | Tragic 2.7% |
| Alaska Natives | 0.0 /100 | #318 | Tragic 2.7% |
Demographics Similar to Immigrants from Uganda by Vision Disability
In terms of vision disability, the demographic groups most similar to Immigrants from Uganda are Immigrants from Philippines (2.1%, a difference of 0.0%), Immigrants from Zimbabwe (2.1%, a difference of 0.060%), Polish (2.1%, a difference of 0.14%), Ugandan (2.1%, a difference of 0.18%), and Immigrants from Vietnam (2.1%, a difference of 0.19%).
| Demographics | Rating | Rank | Vision Disability |
| Immigrants | Denmark | 92.9 /100 | #112 | Exceptional 2.1% |
| Kenyans | 92.5 /100 | #113 | Exceptional 2.1% |
| Croatians | 92.3 /100 | #114 | Exceptional 2.1% |
| Immigrants | Vietnam | 92.2 /100 | #115 | Exceptional 2.1% |
| Ugandans | 92.2 /100 | #116 | Exceptional 2.1% |
| Poles | 92.0 /100 | #117 | Exceptional 2.1% |
| Immigrants | Philippines | 91.4 /100 | #118 | Exceptional 2.1% |
| Immigrants | Uganda | 91.4 /100 | #119 | Exceptional 2.1% |
| Immigrants | Zimbabwe | 91.0 /100 | #120 | Exceptional 2.1% |
| Immigrants | Scotland | 90.4 /100 | #121 | Exceptional 2.1% |
| Immigrants | Ukraine | 90.4 /100 | #122 | Exceptional 2.1% |
| Immigrants | Albania | 90.4 /100 | #123 | Exceptional 2.1% |
| Immigrants | Spain | 89.8 /100 | #124 | Excellent 2.1% |
| Immigrants | Venezuela | 89.8 /100 | #125 | Excellent 2.1% |
| Immigrants | Peru | 89.5 /100 | #126 | Excellent 2.1% |