Cuban vs Arapaho Vision Disability
COMPARE
Cuban
Arapaho
Vision Disability
Vision Disability Comparison
Cubans
Arapaho
2.4%
VISION DISABILITY
0.1/ 100
METRIC RATING
270th/ 347
METRIC RANK
2.6%
VISION DISABILITY
0.0/ 100
METRIC RATING
308th/ 347
METRIC RANK
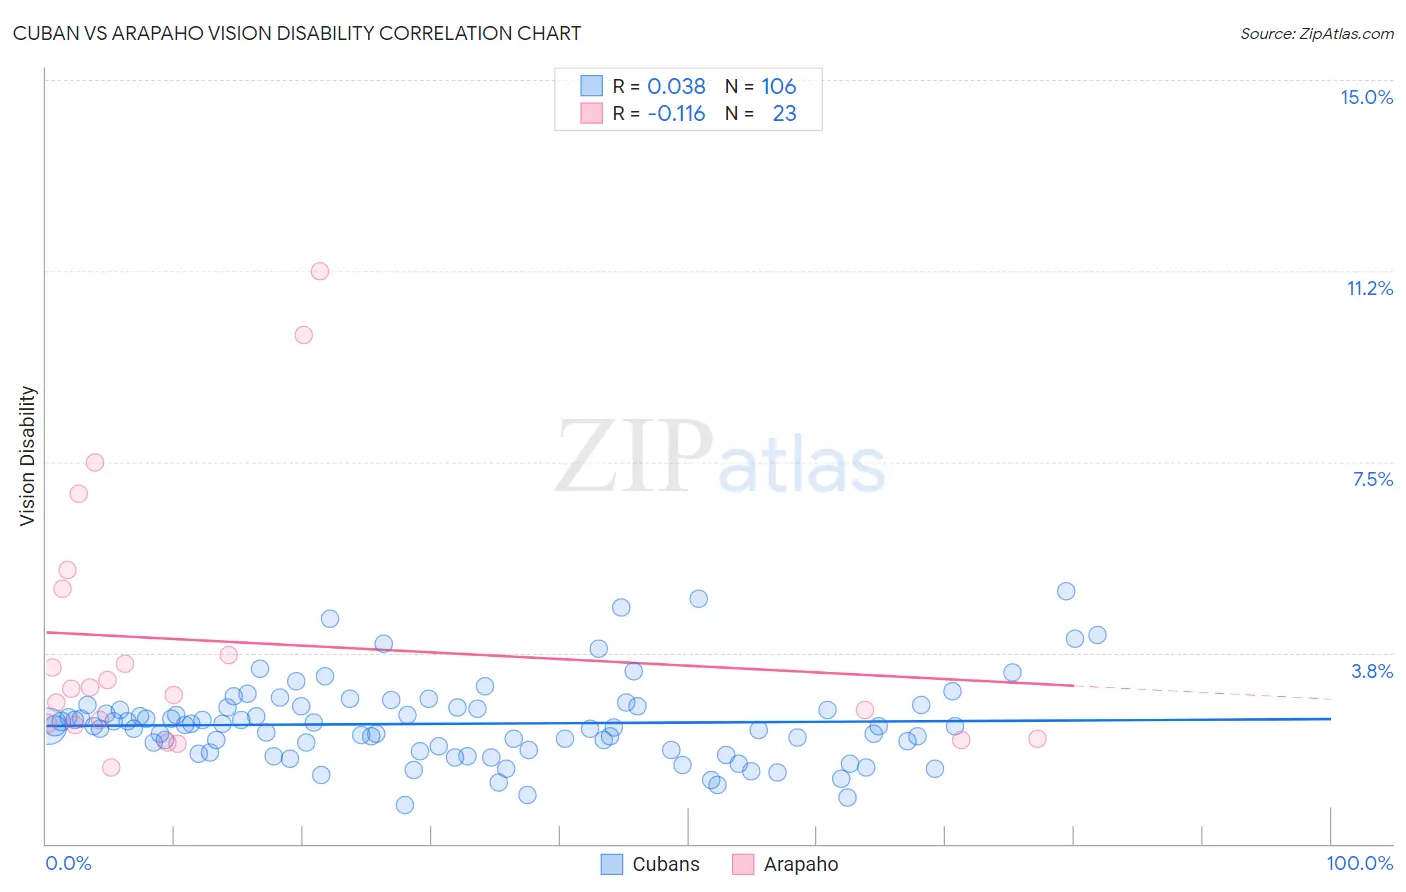
Cuban vs Arapaho Vision Disability Correlation Chart
The statistical analysis conducted on geographies consisting of 448,885,451 people shows no correlation between the proportion of Cubans and percentage of population with vision disability in the United States with a correlation coefficient (R) of 0.038 and weighted average of 2.4%. Similarly, the statistical analysis conducted on geographies consisting of 29,770,133 people shows a poor negative correlation between the proportion of Arapaho and percentage of population with vision disability in the United States with a correlation coefficient (R) of -0.116 and weighted average of 2.6%, a difference of 8.3%.
Vision Disability Correlation Summary
| Measurement | Cuban | Arapaho |
| Minimum | 0.77% | 1.5% |
| Maximum | 5.0% | 11.2% |
| Range | 4.2% | 9.7% |
| Mean | 2.4% | 4.0% |
| Median | 2.3% | 3.1% |
| Interquartile 25% (IQ1) | 1.8% | 2.3% |
| Interquartile 75% (IQ3) | 2.7% | 5.0% |
| Interquartile Range (IQR) | 0.85% | 2.7% |
| Standard Deviation (Sample) | 0.80% | 2.6% |
| Standard Deviation (Population) | 0.79% | 2.5% |
Similar Demographics by Vision Disability
Demographics Similar to Cubans by Vision Disability
In terms of vision disability, the demographic groups most similar to Cubans are Celtic (2.4%, a difference of 0.010%), Immigrants from the Azores (2.4%, a difference of 0.16%), Spaniard (2.4%, a difference of 0.26%), Senegalese (2.4%, a difference of 0.28%), and Ute (2.4%, a difference of 0.37%).
| Demographics | Rating | Rank | Vision Disability |
| Immigrants | Belize | 0.1 /100 | #263 | Tragic 2.4% |
| Immigrants | Liberia | 0.1 /100 | #264 | Tragic 2.4% |
| Immigrants | Jamaica | 0.1 /100 | #265 | Tragic 2.4% |
| Mexican American Indians | 0.1 /100 | #266 | Tragic 2.4% |
| Ute | 0.1 /100 | #267 | Tragic 2.4% |
| Senegalese | 0.1 /100 | #268 | Tragic 2.4% |
| Celtics | 0.1 /100 | #269 | Tragic 2.4% |
| Cubans | 0.1 /100 | #270 | Tragic 2.4% |
| Immigrants | Azores | 0.1 /100 | #271 | Tragic 2.4% |
| Spaniards | 0.1 /100 | #272 | Tragic 2.4% |
| Immigrants | Bahamas | 0.1 /100 | #273 | Tragic 2.4% |
| Immigrants | Latin America | 0.0 /100 | #274 | Tragic 2.4% |
| Chippewa | 0.0 /100 | #275 | Tragic 2.4% |
| Scotch-Irish | 0.0 /100 | #276 | Tragic 2.4% |
| Bahamians | 0.0 /100 | #277 | Tragic 2.4% |
Demographics Similar to Arapaho by Vision Disability
In terms of vision disability, the demographic groups most similar to Arapaho are Immigrants from Dominican Republic (2.6%, a difference of 0.020%), Iroquois (2.6%, a difference of 0.040%), Immigrants from Yemen (2.6%, a difference of 0.29%), Blackfeet (2.6%, a difference of 0.61%), and Hispanic or Latino (2.6%, a difference of 0.65%).
| Demographics | Rating | Rank | Vision Disability |
| Menominee | 0.0 /100 | #301 | Tragic 2.5% |
| Spanish American Indians | 0.0 /100 | #302 | Tragic 2.6% |
| Immigrants | Cabo Verde | 0.0 /100 | #303 | Tragic 2.6% |
| Aleuts | 0.0 /100 | #304 | Tragic 2.6% |
| Hispanics or Latinos | 0.0 /100 | #305 | Tragic 2.6% |
| Iroquois | 0.0 /100 | #306 | Tragic 2.6% |
| Immigrants | Dominican Republic | 0.0 /100 | #307 | Tragic 2.6% |
| Arapaho | 0.0 /100 | #308 | Tragic 2.6% |
| Immigrants | Yemen | 0.0 /100 | #309 | Tragic 2.6% |
| Blackfeet | 0.0 /100 | #310 | Tragic 2.6% |
| Dominicans | 0.0 /100 | #311 | Tragic 2.6% |
| Americans | 0.0 /100 | #312 | Tragic 2.6% |
| Potawatomi | 0.0 /100 | #313 | Tragic 2.6% |
| Inupiat | 0.0 /100 | #314 | Tragic 2.7% |
| Osage | 0.0 /100 | #315 | Tragic 2.7% |