Costa Rican vs Immigrants from Belgium Hearing Disability
COMPARE
Costa Rican
Immigrants from Belgium
Hearing Disability
Hearing Disability Comparison
Costa Ricans
Immigrants from Belgium
2.9%
HEARING DISABILITY
71.4/ 100
METRIC RATING
155th/ 347
METRIC RANK
3.0%
HEARING DISABILITY
41.5/ 100
METRIC RATING
181st/ 347
METRIC RANK
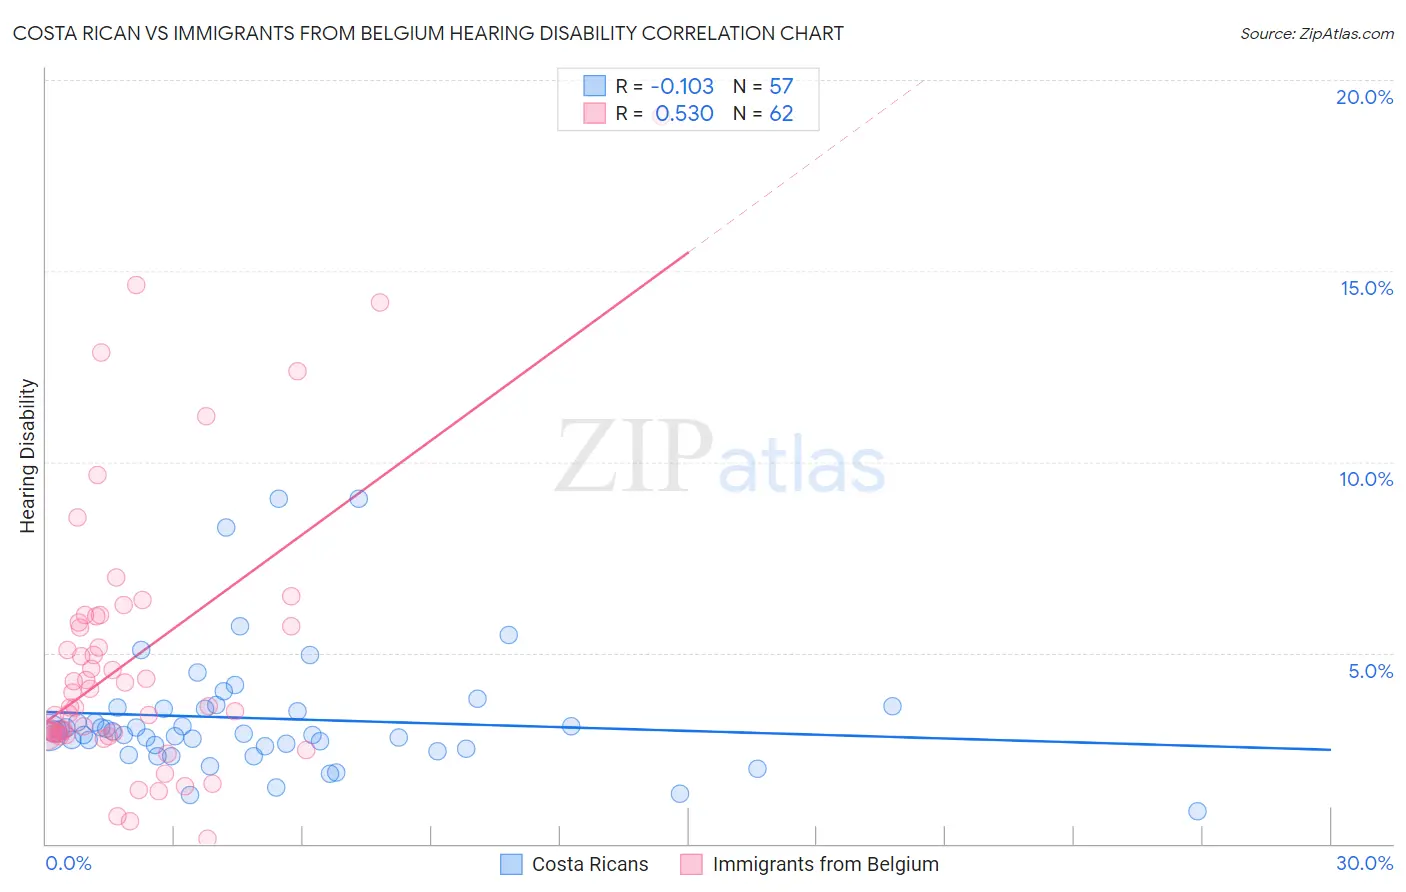
Costa Rican vs Immigrants from Belgium Hearing Disability Correlation Chart
The statistical analysis conducted on geographies consisting of 253,538,538 people shows a poor negative correlation between the proportion of Costa Ricans and percentage of population with hearing disability in the United States with a correlation coefficient (R) of -0.103 and weighted average of 2.9%. Similarly, the statistical analysis conducted on geographies consisting of 146,709,031 people shows a substantial positive correlation between the proportion of Immigrants from Belgium and percentage of population with hearing disability in the United States with a correlation coefficient (R) of 0.530 and weighted average of 3.0%, a difference of 3.0%.
Hearing Disability Correlation Summary
| Measurement | Costa Rican | Immigrants from Belgium |
| Minimum | 0.86% | 0.12% |
| Maximum | 9.0% | 19.0% |
| Range | 8.2% | 18.9% |
| Mean | 3.3% | 4.8% |
| Median | 2.9% | 3.6% |
| Interquartile 25% (IQ1) | 2.5% | 2.9% |
| Interquartile 75% (IQ3) | 3.6% | 5.8% |
| Interquartile Range (IQR) | 1.0% | 2.9% |
| Standard Deviation (Sample) | 1.6% | 3.6% |
| Standard Deviation (Population) | 1.6% | 3.6% |
Similar Demographics by Hearing Disability
Demographics Similar to Costa Ricans by Hearing Disability
In terms of hearing disability, the demographic groups most similar to Costa Ricans are Immigrants from Lebanon (2.9%, a difference of 0.010%), Sudanese (2.9%, a difference of 0.090%), Immigrants from Poland (2.9%, a difference of 0.14%), Immigrants from Lithuania (2.9%, a difference of 0.19%), and Immigrants from France (2.9%, a difference of 0.21%).
| Demographics | Rating | Rank | Hearing Disability |
| Immigrants | Russia | 77.7 /100 | #148 | Good 2.9% |
| Immigrants | Panama | 76.9 /100 | #149 | Good 2.9% |
| Palestinians | 73.6 /100 | #150 | Good 2.9% |
| Immigrants | France | 73.1 /100 | #151 | Good 2.9% |
| Immigrants | Lithuania | 73.0 /100 | #152 | Good 2.9% |
| Sudanese | 72.1 /100 | #153 | Good 2.9% |
| Immigrants | Lebanon | 71.5 /100 | #154 | Good 2.9% |
| Costa Ricans | 71.4 /100 | #155 | Good 2.9% |
| Immigrants | Poland | 70.2 /100 | #156 | Good 2.9% |
| Immigrants | Kazakhstan | 69.6 /100 | #157 | Good 2.9% |
| Immigrants | Burma/Myanmar | 69.5 /100 | #158 | Good 2.9% |
| Immigrants | Australia | 67.4 /100 | #159 | Good 2.9% |
| Immigrants | Fiji | 67.1 /100 | #160 | Good 2.9% |
| Albanians | 66.6 /100 | #161 | Good 2.9% |
| Immigrants | Japan | 66.3 /100 | #162 | Good 2.9% |
Demographics Similar to Immigrants from Belgium by Hearing Disability
In terms of hearing disability, the demographic groups most similar to Immigrants from Belgium are Immigrants from Italy (3.0%, a difference of 0.030%), Immigrants from Sweden (3.0%, a difference of 0.090%), Immigrants from Moldova (3.0%, a difference of 0.15%), Bulgarian (3.0%, a difference of 0.17%), and Immigrants from Ireland (3.0%, a difference of 0.40%).
| Demographics | Rating | Rank | Hearing Disability |
| Indonesians | 50.0 /100 | #174 | Average 3.0% |
| Immigrants | Romania | 48.4 /100 | #175 | Average 3.0% |
| Panamanians | 47.0 /100 | #176 | Average 3.0% |
| Immigrants | Philippines | 46.4 /100 | #177 | Average 3.0% |
| Japanese | 46.0 /100 | #178 | Average 3.0% |
| Immigrants | Moldova | 43.1 /100 | #179 | Average 3.0% |
| Immigrants | Sweden | 42.4 /100 | #180 | Average 3.0% |
| Immigrants | Belgium | 41.5 /100 | #181 | Average 3.0% |
| Immigrants | Italy | 41.1 /100 | #182 | Average 3.0% |
| Bulgarians | 39.7 /100 | #183 | Fair 3.0% |
| Immigrants | Ireland | 37.4 /100 | #184 | Fair 3.0% |
| Immigrants | Southern Europe | 35.3 /100 | #185 | Fair 3.0% |
| Immigrants | Mexico | 34.9 /100 | #186 | Fair 3.0% |
| Blacks/African Americans | 34.7 /100 | #187 | Fair 3.0% |
| Mexican American Indians | 34.7 /100 | #188 | Fair 3.0% |