Comanche vs Immigrants from Latvia Ambulatory Disability

COMPARE

Comanche
Race
Ancestry
AfghanAfricanAlaska NativeAlaskan AthabascanAlbanianAleutAlsatianAmericanApacheArabArapahoArgentineanArmenianAssyrian/Chaldean/SyriacAustralianAustrianBahamianBangladeshiBarbadianBasqueBelgianBelizeanBermudanBhutaneseBlackfeetBolivianBrazilianBritishBritish West IndianBulgarianBurmeseCajunCambodianCanadianCape VerdeanCarpatho RusynCelticCentral AmericanCentral American IndianCherokeeCheyenneChickasawChileanChineseChippewaChoctawColombianColvilleComancheCosta RicanCreeCreekCroatianCrowCubanCypriotCzechCzechoslovakianDanishDelawareDominicanDutchDutch West IndianEastern EuropeanEcuadorianEgyptianEnglishEstonianEthiopianEuropeanFijianFilipinoFinnishFrenchFrench American IndianFrench CanadianGermanGerman RussianGhanaianGreekGuamanian/ChamorroGuatemalanGuyaneseHaitianHmongHonduranHopiHoumaHungarianIcelanderIndian (Asian)IndonesianInupiatIranianIraqiIrishIroquoisIsraeliItalianJamaicanJapaneseJordanianKenyanKiowaKoreanLaotianLatvianLebaneseLiberianLithuanianLumbeeLuxembourgerMacedonianMalaysianMalteseMarshalleseMenomineeMexicanMexican American IndianMongolianMoroccanNative HawaiianNavajoNepaleseNew ZealanderNicaraguanNigerianNorthern EuropeanNorwegianOkinawanOsageOttawaPaiutePakistaniPalestinianPanamanianParaguayanPennsylvania GermanPeruvianPimaPolishPortuguesePotawatomiPuebloPuerto RicanPuget Sound SalishRomanianRussianSalvadoranSamoanScandinavianScotch-IrishScottishSeminoleSenegaleseSerbianShoshoneSierra LeoneanSiouxSlavicSlovakSloveneSomaliSouth AfricanSouth AmericanSouth American IndianSoviet UnionSpaniardSpanishSpanish AmericanSpanish American IndianSri LankanSubsaharan AfricanSudaneseSwedishSwissSyrianTaiwaneseThaiTlingit-HaidaTohono O'OdhamTonganTrinidadian and TobagonianTsimshianTurkishU.S. Virgin IslanderUgandanUkrainianUruguayanUteVenezuelanVietnameseWelshWest IndianYakamaYaquiYugoslavianYumanYup'ikZimbabwean
Immigration
NonimmigrantsImmigrantsAfghanistanAfricaAlbaniaArgentinaArmeniaAsiaAustraliaAustriaBahamasBangladeshBarbadosBelarusBelgiumBelizeBoliviaBosnia and HerzegovinaBrazilBulgariaBurma/MyanmarCabo VerdeCambodiaCameroonCanadaCaribbeanCentral AmericaChileChinaColombiaCongoCosta RicaCroatiaCubaCzechoslovakiaDenmarkDominicaDominican RepublicEastern AfricaEastern AsiaEastern EuropeEcuadorEgyptEl SalvadorEnglandEritreaEthiopiaEuropeFijiFranceGermanyGhanaGreeceGrenadaGuatemalaGuyanaHaitiHondurasHong KongHungaryIndiaIndonesiaIranIraqIrelandIsraelItalyJamaicaJapanJordanKazakhstanKenyaKoreaKuwaitLaosLatin AmericaLebanonLiberiaLithuaniaMalaysiaMexicoMicronesiaMiddle AfricaMoldovaMoroccoNepalNetherlandsNicaraguaNigeriaNorth AmericaNorth MacedoniaNorthern AfricaNorthern EuropeNorwayOceaniaPakistanPanamaPeruPhilippinesPolandPortugalRomaniaRussiaSaudi ArabiaScotlandSenegalSerbiaSierra LeoneSingaporeSomaliaSouth AfricaSouth AmericaSouth Central AsiaSouth Eastern AsiaSouthern EuropeSpainSri LankaSt. Vincent and the GrenadinesSudanSwedenSwitzerlandSyriaTaiwanThailandTrinidad and TobagoTurkeyUgandaUkraineUruguayUzbekistanVenezuelaVietnamWest IndiesWestern AfricaWestern AsiaWestern EuropeYemenZaireZimbabweAzores
Immigrants from Latvia
Race
Ancestry
AfghanAfricanAlaska NativeAlaskan AthabascanAlbanianAleutAlsatianAmericanApacheArabArapahoArgentineanArmenianAssyrian/Chaldean/SyriacAustralianAustrianBahamianBangladeshiBarbadianBasqueBelgianBelizeanBermudanBhutaneseBlackfeetBolivianBrazilianBritishBritish West IndianBulgarianBurmeseCajunCambodianCanadianCape VerdeanCarpatho RusynCelticCentral AmericanCentral American IndianCherokeeCheyenneChickasawChileanChineseChippewaChoctawColombianColvilleCosta RicanCreeCreekCroatianCrowCubanCypriotCzechCzechoslovakianDanishDelawareDominicanDutchDutch West IndianEastern EuropeanEcuadorianEgyptianEnglishEstonianEthiopianEuropeanFijianFilipinoFinnishFrenchFrench American IndianFrench CanadianGermanGerman RussianGhanaianGreekGuamanian/ChamorroGuatemalanGuyaneseHaitianHmongHonduranHopiHoumaHungarianIcelanderIndian (Asian)IndonesianInupiatIranianIraqiIrishIroquoisIsraeliItalianJamaicanJapaneseJordanianKenyanKiowaKoreanLaotianLatvianLebaneseLiberianLithuanianLumbeeLuxembourgerMacedonianMalaysianMalteseMarshalleseMenomineeMexicanMexican American IndianMongolianMoroccanNative HawaiianNavajoNepaleseNew ZealanderNicaraguanNigerianNorthern EuropeanNorwegianOkinawanOsageOttawaPaiutePakistaniPalestinianPanamanianParaguayanPennsylvania GermanPeruvianPimaPolishPortuguesePotawatomiPuebloPuerto RicanPuget Sound SalishRomanianRussianSalvadoranSamoanScandinavianScotch-IrishScottishSeminoleSenegaleseSerbianShoshoneSierra LeoneanSiouxSlavicSlovakSloveneSomaliSouth AfricanSouth AmericanSouth American IndianSoviet UnionSpaniardSpanishSpanish AmericanSpanish American IndianSri LankanSubsaharan AfricanSudaneseSwedishSwissSyrianTaiwaneseThaiTlingit-HaidaTohono O'OdhamTonganTrinidadian and TobagonianTsimshianTurkishU.S. Virgin IslanderUgandanUkrainianUruguayanUteVenezuelanVietnameseWelshWest IndianYakamaYaquiYugoslavianYumanYup'ikZimbabwean
Immigration
NonimmigrantsImmigrantsAfghanistanAfricaAlbaniaArgentinaArmeniaAsiaAustraliaAustriaBahamasBangladeshBarbadosBelarusBelgiumBelizeBoliviaBosnia and HerzegovinaBrazilBulgariaBurma/MyanmarCabo VerdeCambodiaCameroonCanadaCaribbeanCentral AmericaChileChinaColombiaCongoCosta RicaCroatiaCubaCzechoslovakiaDenmarkDominicaDominican RepublicEastern AfricaEastern AsiaEastern EuropeEcuadorEgyptEl SalvadorEnglandEritreaEthiopiaEuropeFijiFranceGermanyGhanaGreeceGrenadaGuatemalaGuyanaHaitiHondurasHong KongHungaryIndiaIndonesiaIranIraqIrelandIsraelItalyJamaicaJapanJordanKazakhstanKenyaKoreaKuwaitLaosLatin AmericaLatviaLebanonLiberiaLithuaniaMalaysiaMexicoMicronesiaMiddle AfricaMoldovaMoroccoNepalNetherlandsNicaraguaNigeriaNorth AmericaNorth MacedoniaNorthern AfricaNorthern EuropeNorwayOceaniaPakistanPanamaPeruPhilippinesPolandPortugalRomaniaRussiaSaudi ArabiaScotlandSenegalSerbiaSierra LeoneSingaporeSomaliaSouth AfricaSouth AmericaSouth Central AsiaSouth Eastern AsiaSouthern EuropeSpainSri LankaSt. Vincent and the GrenadinesSudanSwedenSwitzerlandSyriaTaiwanThailandTrinidad and TobagoTurkeyUgandaUkraineUruguayUzbekistanVenezuelaVietnamWest IndiesWestern AfricaWestern AsiaWestern EuropeYemenZaireZimbabweAzores
Ambulatory Disability
Income
Poverty
Unemployment
Labor Participation
Family Structure
Vehicle Availability
Education Level
Disability

Ambulatory Disability Comparison

Comanche

Immigrants from Latvia

Tragic
Good
7.5%
AMBULATORY DISABILITY
0.0/ 100
METRIC RATING
325th/ 347
METRIC RANK
6.0%
AMBULATORY DISABILITY
71.1/ 100
METRIC RATING
159th/ 347
METRIC RANK

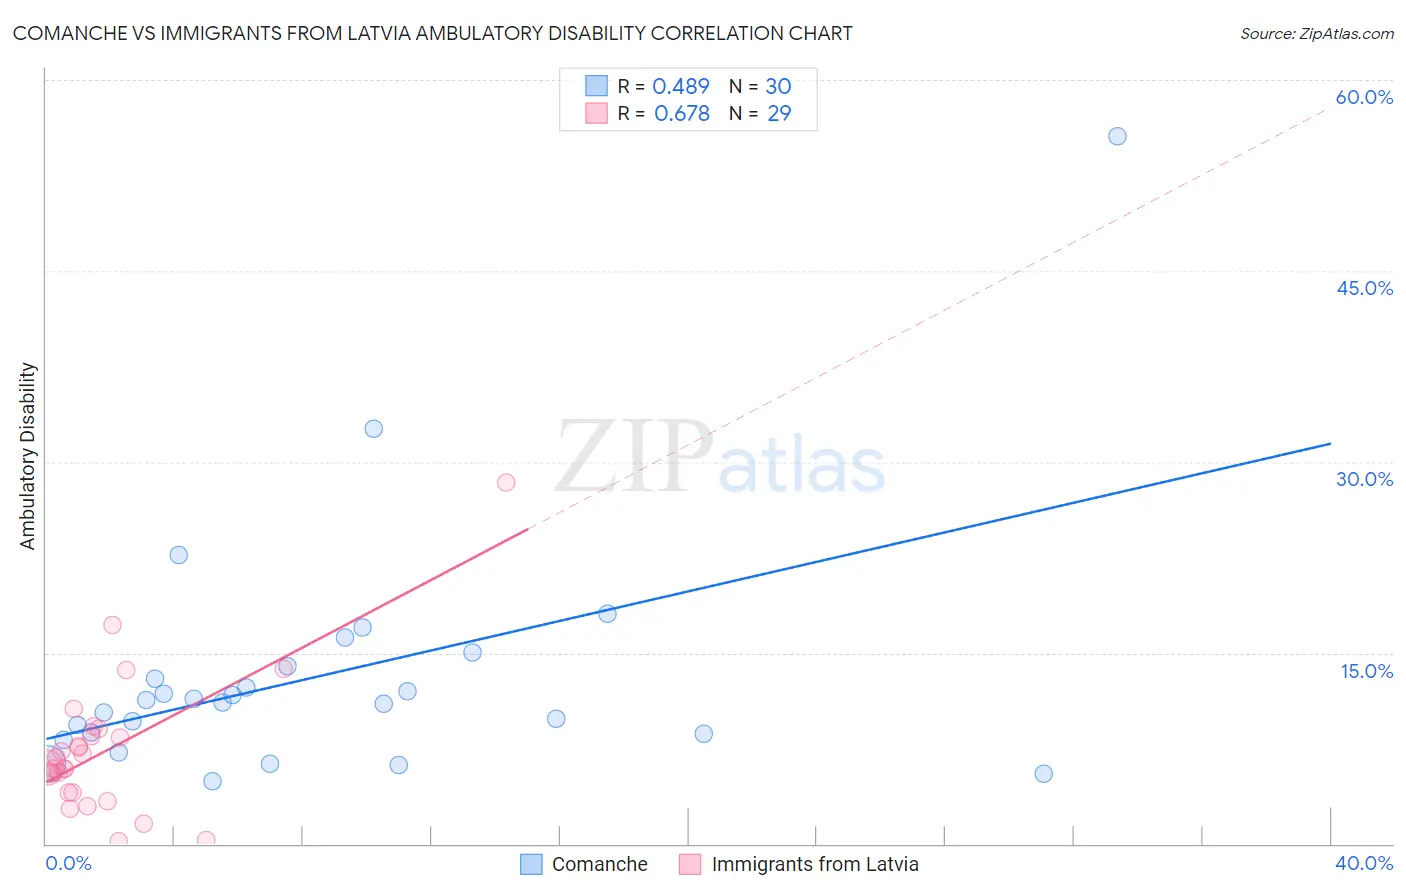
Comanche vs Immigrants from Latvia Ambulatory Disability Correlation Chart

The statistical analysis conducted on geographies consisting of 109,774,668 people shows a moderate positive correlation between the proportion of Comanche and percentage of population with ambulatory disability in the United States with a correlation coefficient (R) of 0.489 and weighted average of 7.5%. Similarly, the statistical analysis conducted on geographies consisting of 113,736,193 people shows a significant positive correlation between the proportion of Immigrants from Latvia and percentage of population with ambulatory disability in the United States with a correlation coefficient (R) of 0.678 and weighted average of 6.0%, a difference of 24.3%.
Comanche vs Immigrants from Latvia Ambulatory Disability

Ambulatory Disability Correlation Summary

MeasurementComancheImmigrants from Latvia
Minimum4.9%0.16%
Maximum55.6%28.4%
Range50.6%28.2%
Mean13.3%7.4%
Median11.2%6.0%
Interquartile 25% (IQ1)8.6%4.0%
Interquartile 75% (IQ3)13.9%8.7%
Interquartile Range (IQR)5.3%4.7%
Standard Deviation (Sample)9.7%5.6%
Standard Deviation (Population)9.6%5.5%

Similar Demographics by Ambulatory Disability

Demographics Similar to Comanche by Ambulatory Disability

In terms of ambulatory disability, the demographic groups most similar to Comanche are Navajo (7.5%, a difference of 0.070%), Black/African American (7.5%, a difference of 0.11%), Native/Alaskan (7.5%, a difference of 0.12%), Hopi (7.6%, a difference of 1.1%), and Pueblo (7.6%, a difference of 1.1%).
DemographicsRating | RankAmbulatory Disability
Ottawa
0.0
/100
|
#318
Tragic
7.2%
Dominicans
0.0
/100
|
#319
Tragic
7.2%
Potawatomi
0.0
/100
|
#320
Tragic
7.3%
Apache
0.0
/100
|
#321
Tragic
7.4%
Osage
0.0
/100
|
#322
Tragic
7.4%
Americans
0.0
/100
|
#323
Tragic
7.4%
Navajo
0.0
/100
|
#324
Tragic
7.5%
Comanche
0.0
/100
|
#325
Tragic
7.5%
Blacks/African Americans
0.0
/100
|
#326
Tragic
7.5%
Natives/Alaskans
0.0
/100
|
#327
Tragic
7.5%
Hopi
0.0
/100
|
#328
Tragic
7.6%
Pueblo
0.0
/100
|
#329
Tragic
7.6%
Paiute
0.0
/100
|
#330
Tragic
7.7%
Cajuns
0.0
/100
|
#331
Tragic
7.8%
Menominee
0.0
/100
|
#332
Tragic
7.8%

Demographics Similar to Immigrants from Latvia by Ambulatory Disability

In terms of ambulatory disability, the demographic groups most similar to Immigrants from Latvia are Immigrants from Fiji (6.0%, a difference of 0.010%), Ghanaian (6.0%, a difference of 0.020%), Northern European (6.0%, a difference of 0.050%), Immigrants from Scotland (6.0%, a difference of 0.070%), and Central American (6.0%, a difference of 0.080%).
DemographicsRating | RankAmbulatory Disability
Immigrants | Austria
78.8
/100
|
#152
Good
6.0%
Syrians
75.5
/100
|
#153
Good
6.0%
Immigrants | Croatia
75.1
/100
|
#154
Good
6.0%
Immigrants | Scotland
72.1
/100
|
#155
Good
6.0%
Northern Europeans
71.8
/100
|
#156
Good
6.0%
Ghanaians
71.3
/100
|
#157
Good
6.0%
Immigrants | Fiji
71.2
/100
|
#158
Good
6.0%
Immigrants | Latvia
71.1
/100
|
#159
Good
6.0%
Central Americans
69.8
/100
|
#160
Good
6.0%
Immigrants | Belarus
69.2
/100
|
#161
Good
6.1%
Nigerians
67.1
/100
|
#162
Good
6.1%
Lebanese
66.2
/100
|
#163
Good
6.1%
Basques
63.7
/100
|
#164
Good
6.1%
Nicaraguans
63.2
/100
|
#165
Good
6.1%
Iraqis
62.8
/100
|
#166
Good
6.1%