Chickasaw vs Immigrants from Micronesia Disability Age 65 to 74
COMPARE
Chickasaw
Immigrants from Micronesia
Disability Age 65 to 74
Disability Age 65 to 74 Comparison
Chickasaw
Immigrants from Micronesia
30.2%
DISABILITY AGE 65 TO 74
0.0/ 100
METRIC RATING
331st/ 347
METRIC RANK
26.1%
DISABILITY AGE 65 TO 74
0.0/ 100
METRIC RATING
286th/ 347
METRIC RANK
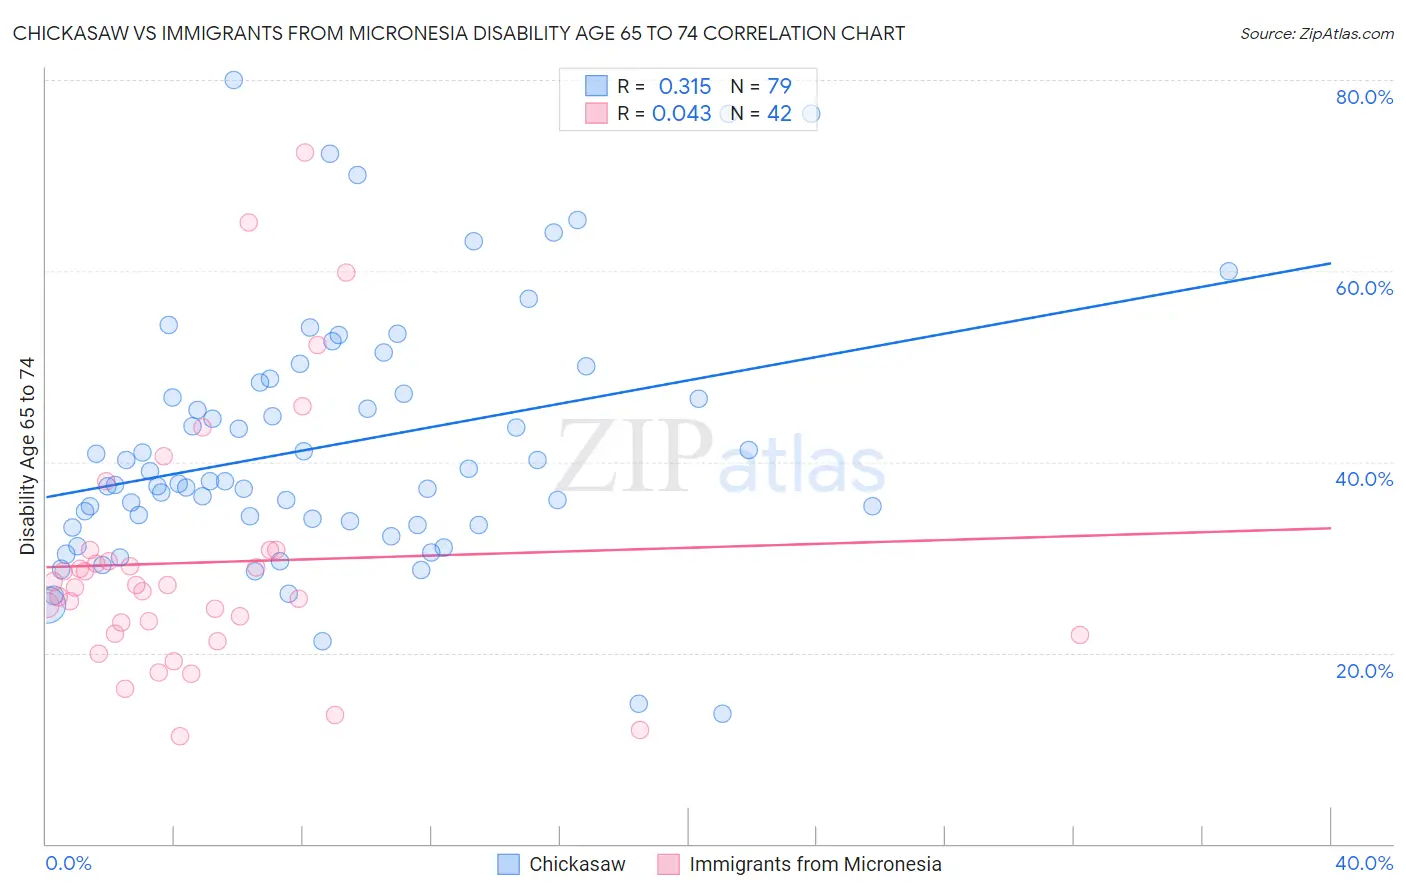
Chickasaw vs Immigrants from Micronesia Disability Age 65 to 74 Correlation Chart
The statistical analysis conducted on geographies consisting of 147,556,011 people shows a mild positive correlation between the proportion of Chickasaw and percentage of population with a disability between the ages 65 and 75 in the United States with a correlation coefficient (R) of 0.315 and weighted average of 30.2%. Similarly, the statistical analysis conducted on geographies consisting of 61,452,747 people shows no correlation between the proportion of Immigrants from Micronesia and percentage of population with a disability between the ages 65 and 75 in the United States with a correlation coefficient (R) of 0.043 and weighted average of 26.1%, a difference of 15.7%.
Disability Age 65 to 74 Correlation Summary
| Measurement | Chickasaw | Immigrants from Micronesia |
| Minimum | 13.6% | 11.3% |
| Maximum | 80.0% | 72.4% |
| Range | 66.4% | 61.1% |
| Mean | 41.7% | 29.5% |
| Median | 38.0% | 27.0% |
| Interquartile 25% (IQ1) | 33.3% | 22.0% |
| Interquartile 75% (IQ3) | 48.3% | 30.8% |
| Interquartile Range (IQR) | 14.9% | 8.8% |
| Standard Deviation (Sample) | 13.4% | 13.2% |
| Standard Deviation (Population) | 13.3% | 13.1% |
Similar Demographics by Disability Age 65 to 74
Demographics Similar to Chickasaw by Disability Age 65 to 74
In terms of disability age 65 to 74, the demographic groups most similar to Chickasaw are Creek (30.2%, a difference of 0.010%), Choctaw (30.2%, a difference of 0.040%), Native/Alaskan (30.4%, a difference of 0.62%), Hopi (30.0%, a difference of 0.84%), and Colville (30.5%, a difference of 1.1%).
| Demographics | Rating | Rank | Disability Age 65 to 74 |
| Seminole | 0.0 /100 | #324 | Tragic 29.4% |
| Dutch West Indians | 0.0 /100 | #325 | Tragic 29.6% |
| Yakama | 0.0 /100 | #326 | Tragic 29.6% |
| Apache | 0.0 /100 | #327 | Tragic 29.7% |
| Hopi | 0.0 /100 | #328 | Tragic 30.0% |
| Choctaw | 0.0 /100 | #329 | Tragic 30.2% |
| Creek | 0.0 /100 | #330 | Tragic 30.2% |
| Chickasaw | 0.0 /100 | #331 | Tragic 30.2% |
| Natives/Alaskans | 0.0 /100 | #332 | Tragic 30.4% |
| Colville | 0.0 /100 | #333 | Tragic 30.5% |
| Alaska Natives | 0.0 /100 | #334 | Tragic 30.6% |
| Cheyenne | 0.0 /100 | #335 | Tragic 31.1% |
| Yuman | 0.0 /100 | #336 | Tragic 31.5% |
| Houma | 0.0 /100 | #337 | Tragic 32.3% |
| Alaskan Athabascans | 0.0 /100 | #338 | Tragic 32.4% |
Demographics Similar to Immigrants from Micronesia by Disability Age 65 to 74
In terms of disability age 65 to 74, the demographic groups most similar to Immigrants from Micronesia are Immigrants from Laos (26.1%, a difference of 0.070%), Mexican American Indian (26.2%, a difference of 0.16%), Immigrants from Congo (26.0%, a difference of 0.43%), Immigrants from the Azores (26.0%, a difference of 0.44%), and African (26.2%, a difference of 0.48%).
| Demographics | Rating | Rank | Disability Age 65 to 74 |
| U.S. Virgin Islanders | 0.1 /100 | #279 | Tragic 25.9% |
| Cree | 0.1 /100 | #280 | Tragic 25.9% |
| Immigrants | Honduras | 0.1 /100 | #281 | Tragic 25.9% |
| Delaware | 0.1 /100 | #282 | Tragic 25.9% |
| Spanish Americans | 0.0 /100 | #283 | Tragic 25.9% |
| Immigrants | Azores | 0.0 /100 | #284 | Tragic 26.0% |
| Immigrants | Congo | 0.0 /100 | #285 | Tragic 26.0% |
| Immigrants | Micronesia | 0.0 /100 | #286 | Tragic 26.1% |
| Immigrants | Laos | 0.0 /100 | #287 | Tragic 26.1% |
| Mexican American Indians | 0.0 /100 | #288 | Tragic 26.2% |
| Africans | 0.0 /100 | #289 | Tragic 26.2% |
| Immigrants | Cabo Verde | 0.0 /100 | #290 | Tragic 26.3% |
| Spanish American Indians | 0.0 /100 | #291 | Tragic 26.4% |
| Blackfeet | 0.0 /100 | #292 | Tragic 26.6% |
| Immigrants | Central America | 0.0 /100 | #293 | Tragic 26.6% |