Cajun vs Indonesian Male Disability
COMPARE
Cajun
Indonesian
Male Disability
Male Disability Comparison
Cajuns
Indonesians
14.4%
MALE DISABILITY
0.0/ 100
METRIC RATING
329th/ 347
METRIC RANK
11.6%
MALE DISABILITY
5.9/ 100
METRIC RATING
215th/ 347
METRIC RANK
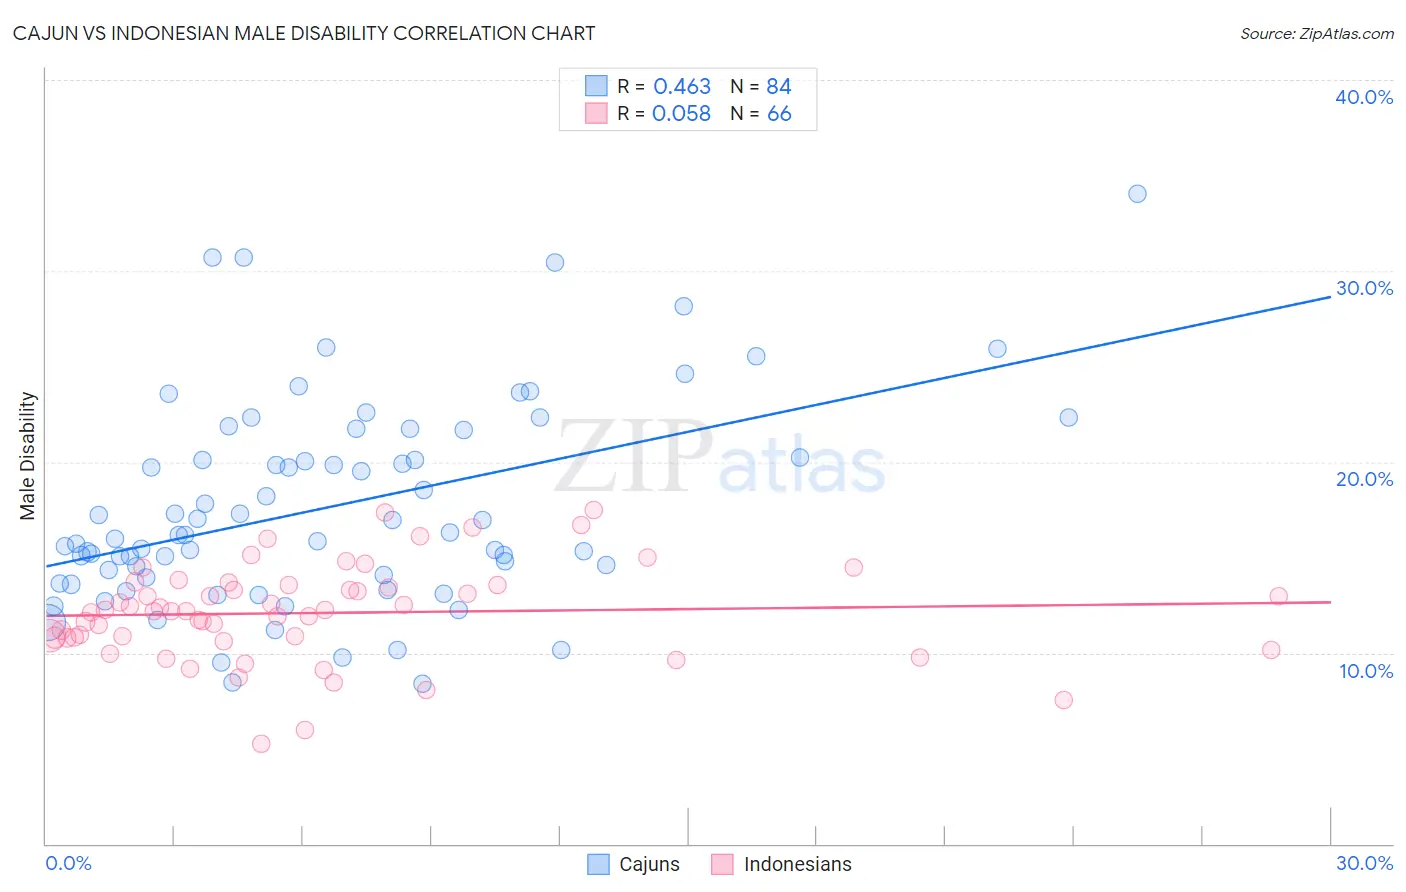
Cajun vs Indonesian Male Disability Correlation Chart
The statistical analysis conducted on geographies consisting of 149,697,026 people shows a moderate positive correlation between the proportion of Cajuns and percentage of males with a disability in the United States with a correlation coefficient (R) of 0.463 and weighted average of 14.4%. Similarly, the statistical analysis conducted on geographies consisting of 162,722,294 people shows a slight positive correlation between the proportion of Indonesians and percentage of males with a disability in the United States with a correlation coefficient (R) of 0.058 and weighted average of 11.6%, a difference of 23.3%.
Male Disability Correlation Summary
| Measurement | Cajun | Indonesian |
| Minimum | 8.4% | 5.2% |
| Maximum | 34.1% | 17.5% |
| Range | 25.7% | 12.2% |
| Mean | 17.7% | 12.1% |
| Median | 16.2% | 12.2% |
| Interquartile 25% (IQ1) | 14.0% | 10.8% |
| Interquartile 75% (IQ3) | 21.0% | 13.5% |
| Interquartile Range (IQR) | 7.0% | 2.7% |
| Standard Deviation (Sample) | 5.4% | 2.5% |
| Standard Deviation (Population) | 5.4% | 2.5% |
Similar Demographics by Male Disability
Demographics Similar to Cajuns by Male Disability
In terms of male disability, the demographic groups most similar to Cajuns are Navajo (14.4%, a difference of 0.23%), Chippewa (14.3%, a difference of 0.57%), Potawatomi (14.2%, a difference of 1.0%), Native/Alaskan (14.2%, a difference of 1.1%), and Tohono O'odham (14.6%, a difference of 1.7%).
| Demographics | Rating | Rank | Male Disability |
| Apache | 0.0 /100 | #322 | Tragic 14.0% |
| Osage | 0.0 /100 | #323 | Tragic 14.0% |
| Comanche | 0.0 /100 | #324 | Tragic 14.1% |
| Ottawa | 0.0 /100 | #325 | Tragic 14.1% |
| Natives/Alaskans | 0.0 /100 | #326 | Tragic 14.2% |
| Potawatomi | 0.0 /100 | #327 | Tragic 14.2% |
| Chippewa | 0.0 /100 | #328 | Tragic 14.3% |
| Cajuns | 0.0 /100 | #329 | Tragic 14.4% |
| Navajo | 0.0 /100 | #330 | Tragic 14.4% |
| Tohono O'odham | 0.0 /100 | #331 | Tragic 14.6% |
| Seminole | 0.0 /100 | #332 | Tragic 14.7% |
| Yuman | 0.0 /100 | #333 | Tragic 14.7% |
| Cherokee | 0.0 /100 | #334 | Tragic 14.8% |
| Dutch West Indians | 0.0 /100 | #335 | Tragic 14.8% |
| Alaskan Athabascans | 0.0 /100 | #336 | Tragic 14.9% |
Demographics Similar to Indonesians by Male Disability
In terms of male disability, the demographic groups most similar to Indonesians are Lithuanian (11.6%, a difference of 0.16%), Immigrants from Dominican Republic (11.7%, a difference of 0.28%), Immigrants from Dominica (11.7%, a difference of 0.34%), Mexican American Indian (11.6%, a difference of 0.40%), and Immigrants from Scotland (11.6%, a difference of 0.48%).
| Demographics | Rating | Rank | Male Disability |
| Icelanders | 10.1 /100 | #208 | Poor 11.6% |
| Spanish American Indians | 10.1 /100 | #209 | Poor 11.6% |
| Ute | 9.4 /100 | #210 | Tragic 11.6% |
| Immigrants | Thailand | 8.4 /100 | #211 | Tragic 11.6% |
| Immigrants | Scotland | 8.2 /100 | #212 | Tragic 11.6% |
| Mexican American Indians | 7.8 /100 | #213 | Tragic 11.6% |
| Lithuanians | 6.6 /100 | #214 | Tragic 11.6% |
| Indonesians | 5.9 /100 | #215 | Tragic 11.6% |
| Immigrants | Dominican Republic | 4.9 /100 | #216 | Tragic 11.7% |
| Immigrants | Dominica | 4.6 /100 | #217 | Tragic 11.7% |
| Immigrants | England | 4.0 /100 | #218 | Tragic 11.7% |
| Panamanians | 3.8 /100 | #219 | Tragic 11.7% |
| Immigrants | Western Europe | 3.8 /100 | #220 | Tragic 11.7% |
| Immigrants | Congo | 3.7 /100 | #221 | Tragic 11.7% |
| Alsatians | 3.3 /100 | #222 | Tragic 11.7% |