Bhutanese vs Immigrants from Hong Kong Cognitive Disability
COMPARE
Bhutanese
Immigrants from Hong Kong
Cognitive Disability
Cognitive Disability Comparison
Bhutanese
Immigrants from Hong Kong
16.6%
COGNITIVE DISABILITY
99.7/ 100
METRIC RATING
57th/ 347
METRIC RANK
16.0%
COGNITIVE DISABILITY
100.0/ 100
METRIC RATING
5th/ 347
METRIC RANK
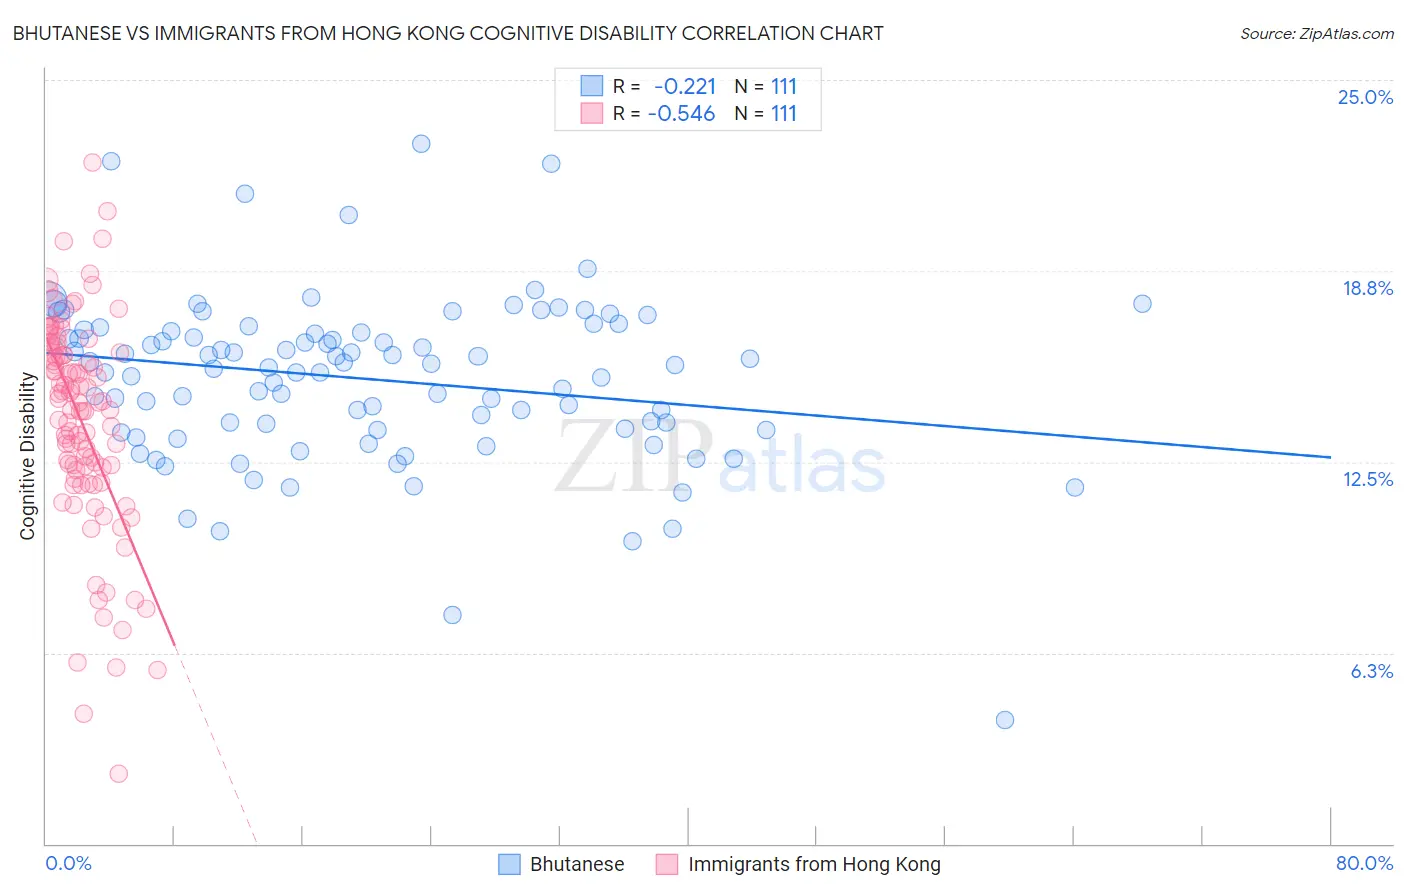
Bhutanese vs Immigrants from Hong Kong Cognitive Disability Correlation Chart
The statistical analysis conducted on geographies consisting of 455,511,378 people shows a weak negative correlation between the proportion of Bhutanese and percentage of population with cognitive disability in the United States with a correlation coefficient (R) of -0.221 and weighted average of 16.6%. Similarly, the statistical analysis conducted on geographies consisting of 253,985,578 people shows a substantial negative correlation between the proportion of Immigrants from Hong Kong and percentage of population with cognitive disability in the United States with a correlation coefficient (R) of -0.546 and weighted average of 16.0%, a difference of 3.4%.
Cognitive Disability Correlation Summary
| Measurement | Bhutanese | Immigrants from Hong Kong |
| Minimum | 4.0% | 2.3% |
| Maximum | 22.9% | 22.3% |
| Range | 18.9% | 20.0% |
| Mean | 15.2% | 13.8% |
| Median | 15.6% | 14.4% |
| Interquartile 25% (IQ1) | 13.6% | 12.2% |
| Interquartile 75% (IQ3) | 16.8% | 16.1% |
| Interquartile Range (IQR) | 3.2% | 3.9% |
| Standard Deviation (Sample) | 2.8% | 3.5% |
| Standard Deviation (Population) | 2.7% | 3.5% |
Similar Demographics by Cognitive Disability
Demographics Similar to Bhutanese by Cognitive Disability
In terms of cognitive disability, the demographic groups most similar to Bhutanese are Austrian (16.6%, a difference of 0.010%), Pennsylvania German (16.6%, a difference of 0.080%), Immigrants from Peru (16.6%, a difference of 0.080%), Romanian (16.6%, a difference of 0.090%), and Immigrants from Venezuela (16.5%, a difference of 0.10%).
| Demographics | Rating | Rank | Cognitive Disability |
| Norwegians | 99.8 /100 | #50 | Exceptional 16.5% |
| Immigrants | Korea | 99.8 /100 | #51 | Exceptional 16.5% |
| Soviet Union | 99.8 /100 | #52 | Exceptional 16.5% |
| Swedes | 99.8 /100 | #53 | Exceptional 16.5% |
| Immigrants | Iran | 99.8 /100 | #54 | Exceptional 16.5% |
| Immigrants | Venezuela | 99.7 /100 | #55 | Exceptional 16.5% |
| Austrians | 99.7 /100 | #56 | Exceptional 16.6% |
| Bhutanese | 99.7 /100 | #57 | Exceptional 16.6% |
| Pennsylvania Germans | 99.7 /100 | #58 | Exceptional 16.6% |
| Immigrants | Peru | 99.7 /100 | #59 | Exceptional 16.6% |
| Romanians | 99.7 /100 | #60 | Exceptional 16.6% |
| Immigrants | England | 99.6 /100 | #61 | Exceptional 16.6% |
| Czechoslovakians | 99.6 /100 | #62 | Exceptional 16.6% |
| Argentineans | 99.6 /100 | #63 | Exceptional 16.6% |
| Venezuelans | 99.6 /100 | #64 | Exceptional 16.6% |
Demographics Similar to Immigrants from Hong Kong by Cognitive Disability
In terms of cognitive disability, the demographic groups most similar to Immigrants from Hong Kong are Immigrants from Lithuania (16.0%, a difference of 0.41%), Chinese (15.9%, a difference of 0.59%), Thai (16.1%, a difference of 0.61%), Immigrants from India (15.9%, a difference of 0.68%), and Immigrants from Ireland (16.1%, a difference of 0.72%).
| Demographics | Rating | Rank | Cognitive Disability |
| Immigrants | Taiwan | 100.0 /100 | #1 | Exceptional 15.7% |
| Immigrants | India | 100.0 /100 | #2 | Exceptional 15.9% |
| Chinese | 100.0 /100 | #3 | Exceptional 15.9% |
| Immigrants | Lithuania | 100.0 /100 | #4 | Exceptional 16.0% |
| Immigrants | Hong Kong | 100.0 /100 | #5 | Exceptional 16.0% |
| Thais | 100.0 /100 | #6 | Exceptional 16.1% |
| Immigrants | Ireland | 100.0 /100 | #7 | Exceptional 16.1% |
| Immigrants | Poland | 100.0 /100 | #8 | Exceptional 16.1% |
| Assyrians/Chaldeans/Syriacs | 100.0 /100 | #9 | Exceptional 16.2% |
| Immigrants | Scotland | 100.0 /100 | #10 | Exceptional 16.2% |
| Immigrants | Czechoslovakia | 100.0 /100 | #11 | Exceptional 16.2% |
| Maltese | 100.0 /100 | #12 | Exceptional 16.2% |
| Lithuanians | 100.0 /100 | #13 | Exceptional 16.3% |
| Immigrants | Austria | 100.0 /100 | #14 | Exceptional 16.3% |
| Immigrants | Greece | 100.0 /100 | #15 | Exceptional 16.3% |