Bermudan vs Vietnamese Ambulatory Disability
COMPARE
Bermudan
Vietnamese
Ambulatory Disability
Ambulatory Disability Comparison
Bermudans
Vietnamese
6.5%
AMBULATORY DISABILITY
0.5/ 100
METRIC RATING
257th/ 347
METRIC RANK
6.1%
AMBULATORY DISABILITY
47.2/ 100
METRIC RATING
175th/ 347
METRIC RANK
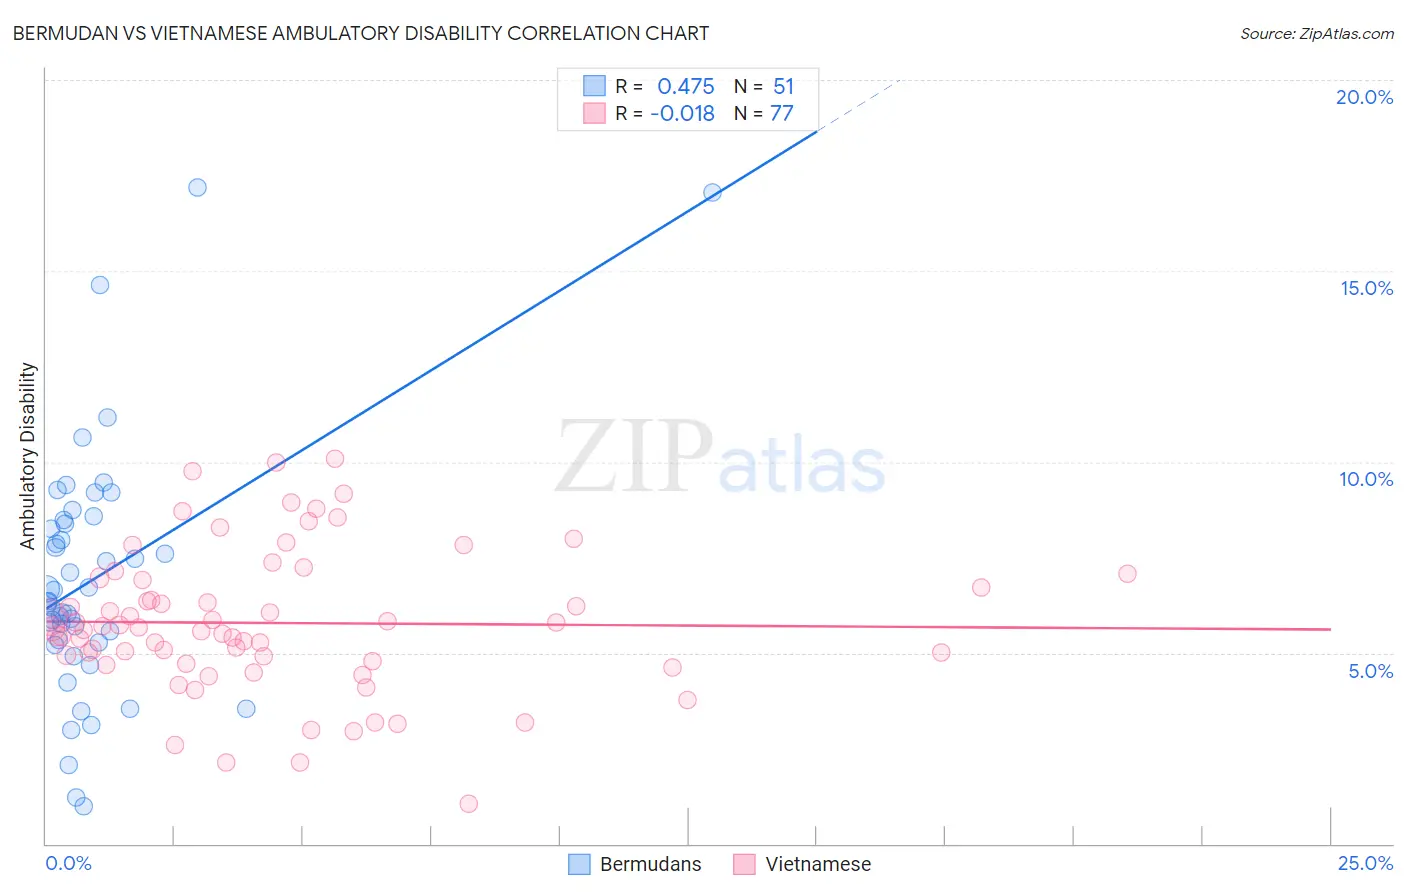
Bermudan vs Vietnamese Ambulatory Disability Correlation Chart
The statistical analysis conducted on geographies consisting of 55,721,081 people shows a moderate positive correlation between the proportion of Bermudans and percentage of population with ambulatory disability in the United States with a correlation coefficient (R) of 0.475 and weighted average of 6.5%. Similarly, the statistical analysis conducted on geographies consisting of 170,721,676 people shows no correlation between the proportion of Vietnamese and percentage of population with ambulatory disability in the United States with a correlation coefficient (R) of -0.018 and weighted average of 6.1%, a difference of 6.7%.
Ambulatory Disability Correlation Summary
| Measurement | Bermudan | Vietnamese |
| Minimum | 0.98% | 1.1% |
| Maximum | 17.2% | 10.1% |
| Range | 16.2% | 9.0% |
| Mean | 7.0% | 5.8% |
| Median | 6.4% | 5.6% |
| Interquartile 25% (IQ1) | 5.3% | 4.7% |
| Interquartile 75% (IQ3) | 8.5% | 6.9% |
| Interquartile Range (IQR) | 3.2% | 2.2% |
| Standard Deviation (Sample) | 3.3% | 1.9% |
| Standard Deviation (Population) | 3.2% | 1.9% |
Similar Demographics by Ambulatory Disability
Demographics Similar to Bermudans by Ambulatory Disability
In terms of ambulatory disability, the demographic groups most similar to Bermudans are Immigrants from Uzbekistan (6.5%, a difference of 0.080%), Spanish American Indian (6.5%, a difference of 0.080%), Welsh (6.5%, a difference of 0.16%), Belizean (6.5%, a difference of 0.23%), and Aleut (6.6%, a difference of 0.26%).
| Demographics | Rating | Rank | Ambulatory Disability |
| Chinese | 1.0 /100 | #250 | Tragic 6.5% |
| Hawaiians | 0.9 /100 | #251 | Tragic 6.5% |
| Immigrants | Bahamas | 0.8 /100 | #252 | Tragic 6.5% |
| Scottish | 0.7 /100 | #253 | Tragic 6.5% |
| Belizeans | 0.7 /100 | #254 | Tragic 6.5% |
| Welsh | 0.6 /100 | #255 | Tragic 6.5% |
| Immigrants | Uzbekistan | 0.6 /100 | #256 | Tragic 6.5% |
| Bermudans | 0.5 /100 | #257 | Tragic 6.5% |
| Spanish American Indians | 0.5 /100 | #258 | Tragic 6.5% |
| Aleuts | 0.4 /100 | #259 | Tragic 6.6% |
| Immigrants | Belize | 0.4 /100 | #260 | Tragic 6.6% |
| Irish | 0.4 /100 | #261 | Tragic 6.6% |
| English | 0.4 /100 | #262 | Tragic 6.6% |
| Hmong | 0.3 /100 | #263 | Tragic 6.6% |
| Nepalese | 0.2 /100 | #264 | Tragic 6.6% |
Demographics Similar to Vietnamese by Ambulatory Disability
In terms of ambulatory disability, the demographic groups most similar to Vietnamese are Immigrants from North America (6.1%, a difference of 0.090%), Immigrants from England (6.1%, a difference of 0.10%), Scandinavian (6.1%, a difference of 0.14%), Immigrants from Canada (6.1%, a difference of 0.15%), and Austrian (6.1%, a difference of 0.17%).
| Demographics | Rating | Rank | Ambulatory Disability |
| Ecuadorians | 60.5 /100 | #168 | Good 6.1% |
| Immigrants | Southern Europe | 58.1 /100 | #169 | Average 6.1% |
| Immigrants | Ecuador | 53.8 /100 | #170 | Average 6.1% |
| Moroccans | 52.6 /100 | #171 | Average 6.1% |
| Immigrants | Burma/Myanmar | 52.2 /100 | #172 | Average 6.1% |
| Croatians | 51.2 /100 | #173 | Average 6.1% |
| Immigrants | Canada | 50.0 /100 | #174 | Average 6.1% |
| Vietnamese | 47.2 /100 | #175 | Average 6.1% |
| Immigrants | North America | 45.6 /100 | #176 | Average 6.1% |
| Immigrants | England | 45.4 /100 | #177 | Average 6.1% |
| Scandinavians | 44.5 /100 | #178 | Average 6.1% |
| Austrians | 44.1 /100 | #179 | Average 6.1% |
| Immigrants | Nicaragua | 43.9 /100 | #180 | Average 6.1% |
| Swiss | 43.1 /100 | #181 | Average 6.1% |
| Serbians | 42.8 /100 | #182 | Average 6.1% |