Aleut vs French Canadian Female Disability
COMPARE
Aleut
French Canadian
Female Disability
Female Disability Comparison
Aleuts
French Canadians
12.7%
FEMALE DISABILITY
1.1/ 100
METRIC RATING
258th/ 347
METRIC RANK
13.6%
FEMALE DISABILITY
0.0/ 100
METRIC RATING
306th/ 347
METRIC RANK
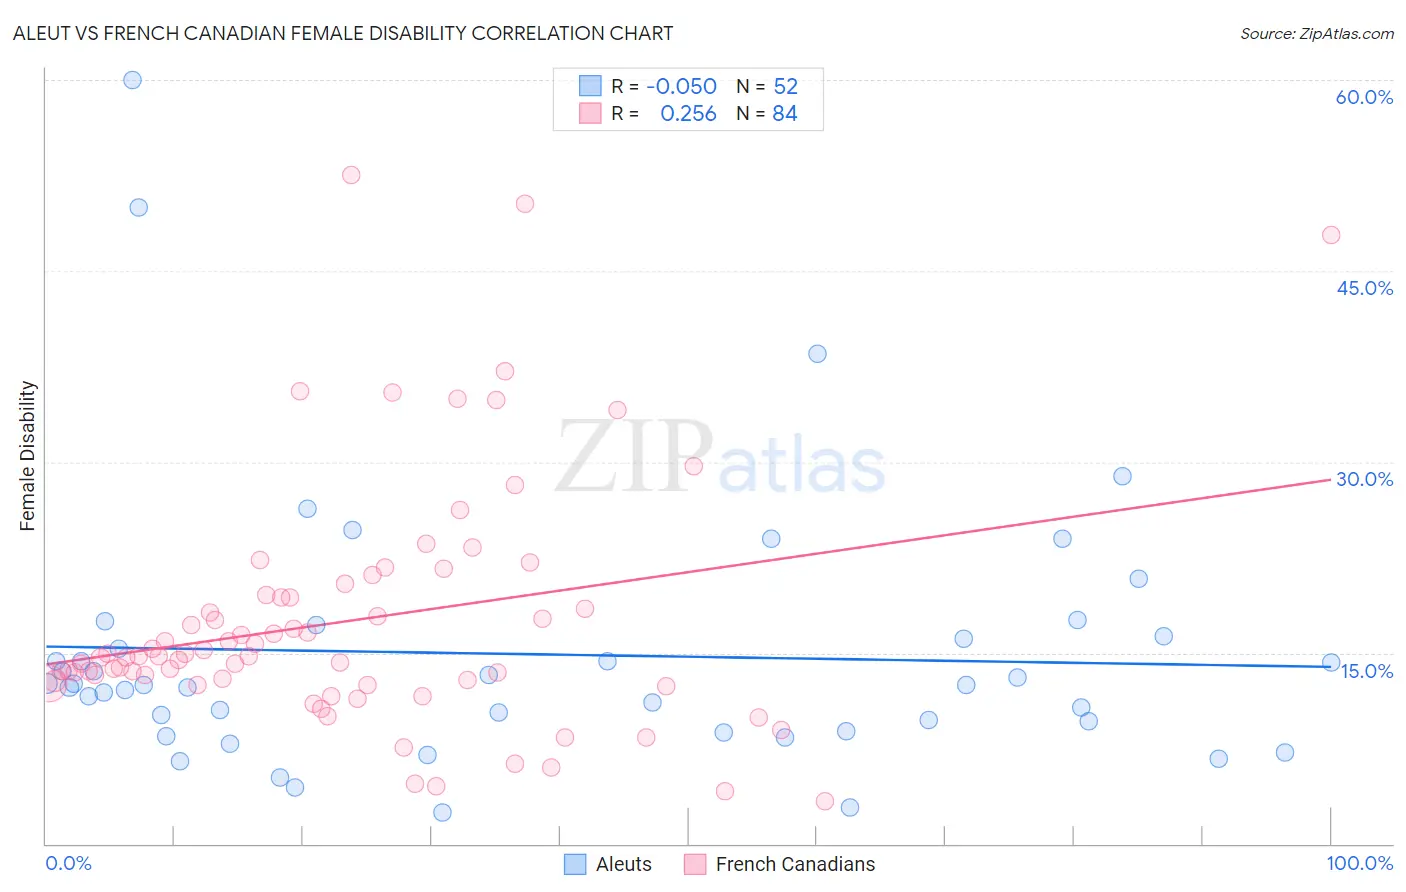
Aleut vs French Canadian Female Disability Correlation Chart
The statistical analysis conducted on geographies consisting of 61,781,040 people shows no correlation between the proportion of Aleuts and percentage of females with a disability in the United States with a correlation coefficient (R) of -0.050 and weighted average of 12.7%. Similarly, the statistical analysis conducted on geographies consisting of 502,526,551 people shows a weak positive correlation between the proportion of French Canadians and percentage of females with a disability in the United States with a correlation coefficient (R) of 0.256 and weighted average of 13.6%, a difference of 6.9%.
Female Disability Correlation Summary
| Measurement | Aleut | French Canadian |
| Minimum | 2.5% | 3.4% |
| Maximum | 60.0% | 52.5% |
| Range | 57.5% | 49.1% |
| Mean | 14.9% | 17.5% |
| Median | 12.5% | 14.7% |
| Interquartile 25% (IQ1) | 9.2% | 12.7% |
| Interquartile 75% (IQ3) | 16.2% | 19.5% |
| Interquartile Range (IQR) | 7.0% | 6.8% |
| Standard Deviation (Sample) | 10.5% | 9.7% |
| Standard Deviation (Population) | 10.4% | 9.6% |
Similar Demographics by Female Disability
Demographics Similar to Aleuts by Female Disability
In terms of female disability, the demographic groups most similar to Aleuts are Liberian (12.7%, a difference of 0.0%), British West Indian (12.7%, a difference of 0.030%), Immigrants from Armenia (12.7%, a difference of 0.080%), Subsaharan African (12.7%, a difference of 0.090%), and Immigrants from Germany (12.7%, a difference of 0.10%).
| Demographics | Rating | Rank | Female Disability |
| Crow | 1.6 /100 | #251 | Tragic 12.7% |
| Immigrants | Caribbean | 1.4 /100 | #252 | Tragic 12.7% |
| Jamaicans | 1.4 /100 | #253 | Tragic 12.7% |
| Hawaiians | 1.4 /100 | #254 | Tragic 12.7% |
| Immigrants | Germany | 1.3 /100 | #255 | Tragic 12.7% |
| British West Indians | 1.2 /100 | #256 | Tragic 12.7% |
| Liberians | 1.1 /100 | #257 | Tragic 12.7% |
| Aleuts | 1.1 /100 | #258 | Tragic 12.7% |
| Immigrants | Armenia | 1.0 /100 | #259 | Tragic 12.7% |
| Sub-Saharan Africans | 1.0 /100 | #260 | Tragic 12.7% |
| Bermudans | 1.0 /100 | #261 | Tragic 12.7% |
| Czechoslovakians | 0.9 /100 | #262 | Tragic 12.7% |
| Spaniards | 0.7 /100 | #263 | Tragic 12.8% |
| Alaska Natives | 0.6 /100 | #264 | Tragic 12.8% |
| West Indians | 0.5 /100 | #265 | Tragic 12.8% |
Demographics Similar to French Canadians by Female Disability
In terms of female disability, the demographic groups most similar to French Canadians are Central American Indian (13.6%, a difference of 0.29%), Dominican (13.5%, a difference of 0.63%), Cree (13.7%, a difference of 0.75%), French American Indian (13.7%, a difference of 0.81%), and Apache (13.7%, a difference of 0.93%).
| Demographics | Rating | Rank | Female Disability |
| Immigrants | Dominican Republic | 0.0 /100 | #299 | Tragic 13.4% |
| Pennsylvania Germans | 0.0 /100 | #300 | Tragic 13.4% |
| Africans | 0.0 /100 | #301 | Tragic 13.4% |
| Scotch-Irish | 0.0 /100 | #302 | Tragic 13.4% |
| Immigrants | Portugal | 0.0 /100 | #303 | Tragic 13.5% |
| Immigrants | Micronesia | 0.0 /100 | #304 | Tragic 13.5% |
| Dominicans | 0.0 /100 | #305 | Tragic 13.5% |
| French Canadians | 0.0 /100 | #306 | Tragic 13.6% |
| Central American Indians | 0.0 /100 | #307 | Tragic 13.6% |
| Cree | 0.0 /100 | #308 | Tragic 13.7% |
| French American Indians | 0.0 /100 | #309 | Tragic 13.7% |
| Apache | 0.0 /100 | #310 | Tragic 13.7% |
| Hopi | 0.0 /100 | #311 | Tragic 13.7% |
| Delaware | 0.0 /100 | #312 | Tragic 13.8% |
| Blackfeet | 0.0 /100 | #313 | Tragic 13.8% |