Alaska Native vs Japanese Ambulatory Disability
COMPARE
Alaska Native
Japanese
Ambulatory Disability
Ambulatory Disability Comparison
Alaska Natives
Japanese
6.2%
AMBULATORY DISABILITY
29.8/ 100
METRIC RATING
194th/ 347
METRIC RANK
6.3%
AMBULATORY DISABILITY
12.0/ 100
METRIC RATING
213th/ 347
METRIC RANK
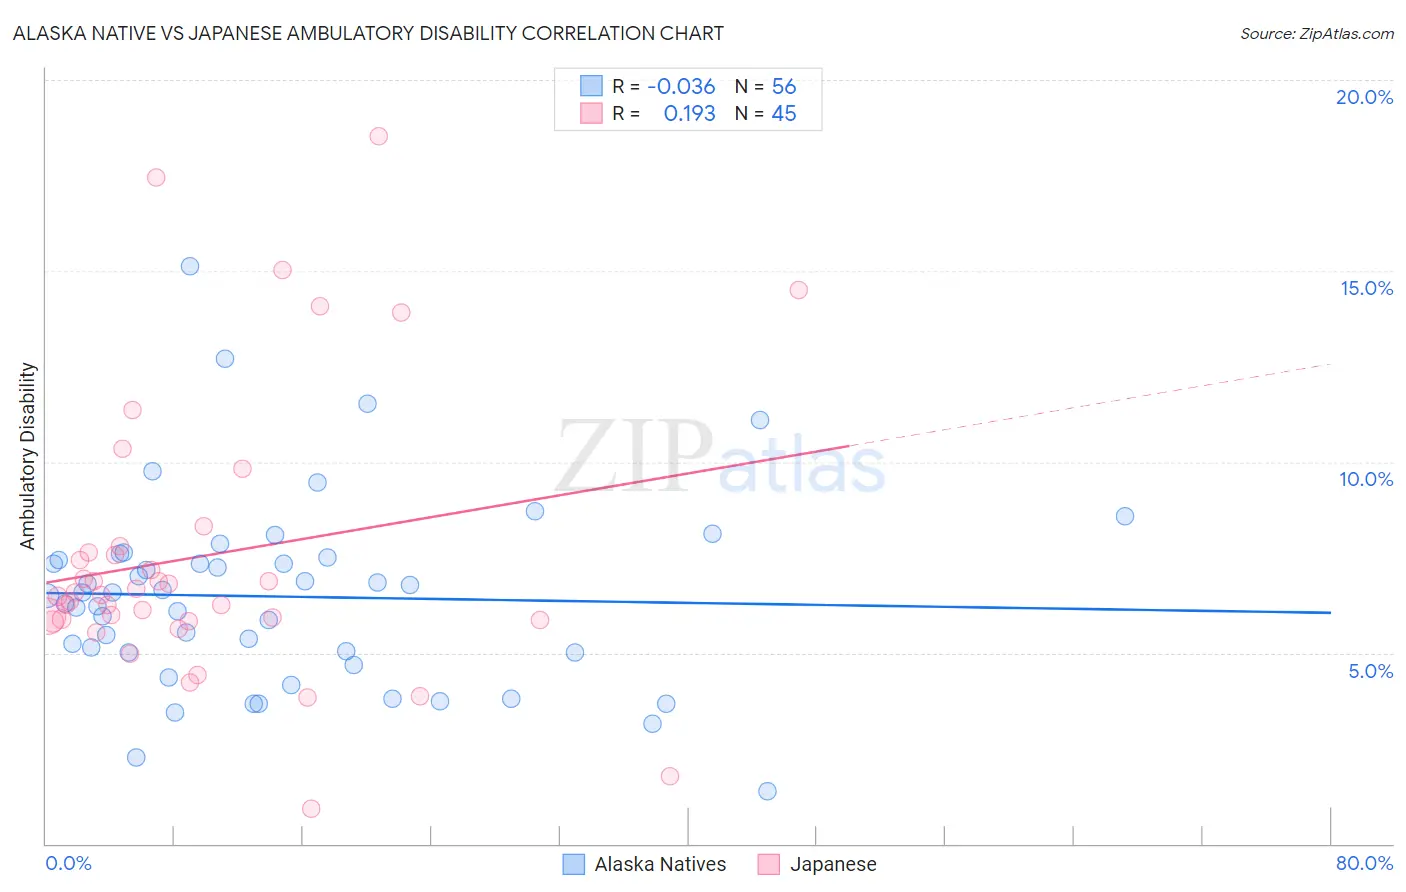
Alaska Native vs Japanese Ambulatory Disability Correlation Chart
The statistical analysis conducted on geographies consisting of 76,753,099 people shows no correlation between the proportion of Alaska Natives and percentage of population with ambulatory disability in the United States with a correlation coefficient (R) of -0.036 and weighted average of 6.2%. Similarly, the statistical analysis conducted on geographies consisting of 249,121,214 people shows a poor positive correlation between the proportion of Japanese and percentage of population with ambulatory disability in the United States with a correlation coefficient (R) of 0.193 and weighted average of 6.3%, a difference of 1.5%.
Ambulatory Disability Correlation Summary
| Measurement | Alaska Native | Japanese |
| Minimum | 1.4% | 0.93% |
| Maximum | 15.1% | 18.5% |
| Range | 13.8% | 17.6% |
| Mean | 6.5% | 7.5% |
| Median | 6.5% | 6.5% |
| Interquartile 25% (IQ1) | 5.0% | 5.8% |
| Interquartile 75% (IQ3) | 7.5% | 7.7% |
| Interquartile Range (IQR) | 2.5% | 1.9% |
| Standard Deviation (Sample) | 2.5% | 3.7% |
| Standard Deviation (Population) | 2.5% | 3.7% |
Demographics Similar to Alaska Natives and Japanese by Ambulatory Disability
In terms of ambulatory disability, the demographic groups most similar to Alaska Natives are Guatemalan (6.2%, a difference of 0.010%), Belgian (6.2%, a difference of 0.080%), Malaysian (6.2%, a difference of 0.10%), Polish (6.2%, a difference of 0.23%), and Immigrants from Bangladesh (6.2%, a difference of 0.35%). Similarly, the demographic groups most similar to Japanese are Mexican American Indian (6.3%, a difference of 0.0%), Samoan (6.3%, a difference of 0.010%), Immigrants from Laos (6.3%, a difference of 0.15%), Immigrants from Iraq (6.3%, a difference of 0.23%), and Bangladeshi (6.3%, a difference of 0.25%).
| Demographics | Rating | Rank | Ambulatory Disability |
| Guatemalans | 30.0 /100 | #193 | Fair 6.2% |
| Alaska Natives | 29.8 /100 | #194 | Fair 6.2% |
| Belgians | 28.6 /100 | #195 | Fair 6.2% |
| Malaysians | 28.2 /100 | #196 | Fair 6.2% |
| Poles | 26.3 /100 | #197 | Fair 6.2% |
| Immigrants | Bangladesh | 24.6 /100 | #198 | Fair 6.2% |
| Italians | 22.6 /100 | #199 | Fair 6.2% |
| Immigrants | Cambodia | 21.5 /100 | #200 | Fair 6.2% |
| Immigrants | Central America | 20.1 /100 | #201 | Fair 6.2% |
| Albanians | 19.7 /100 | #202 | Poor 6.2% |
| Immigrants | Ukraine | 18.4 /100 | #203 | Poor 6.2% |
| Immigrants | Congo | 18.2 /100 | #204 | Poor 6.2% |
| Slovenes | 18.0 /100 | #205 | Poor 6.2% |
| Finns | 17.2 /100 | #206 | Poor 6.2% |
| Alsatians | 15.1 /100 | #207 | Poor 6.3% |
| Bangladeshis | 14.2 /100 | #208 | Poor 6.3% |
| Immigrants | Iraq | 14.0 /100 | #209 | Poor 6.3% |
| Immigrants | Laos | 13.2 /100 | #210 | Poor 6.3% |
| Samoans | 12.1 /100 | #211 | Poor 6.3% |
| Mexican American Indians | 12.0 /100 | #212 | Poor 6.3% |
| Japanese | 12.0 /100 | #213 | Poor 6.3% |