Zip Codes with the Highest Percentage of Households with Income Above $100,000 in Dover, DE
RELATED REPORTS & OPTIONS
Household Income | $100k+
Dover
Compare Zip Codes
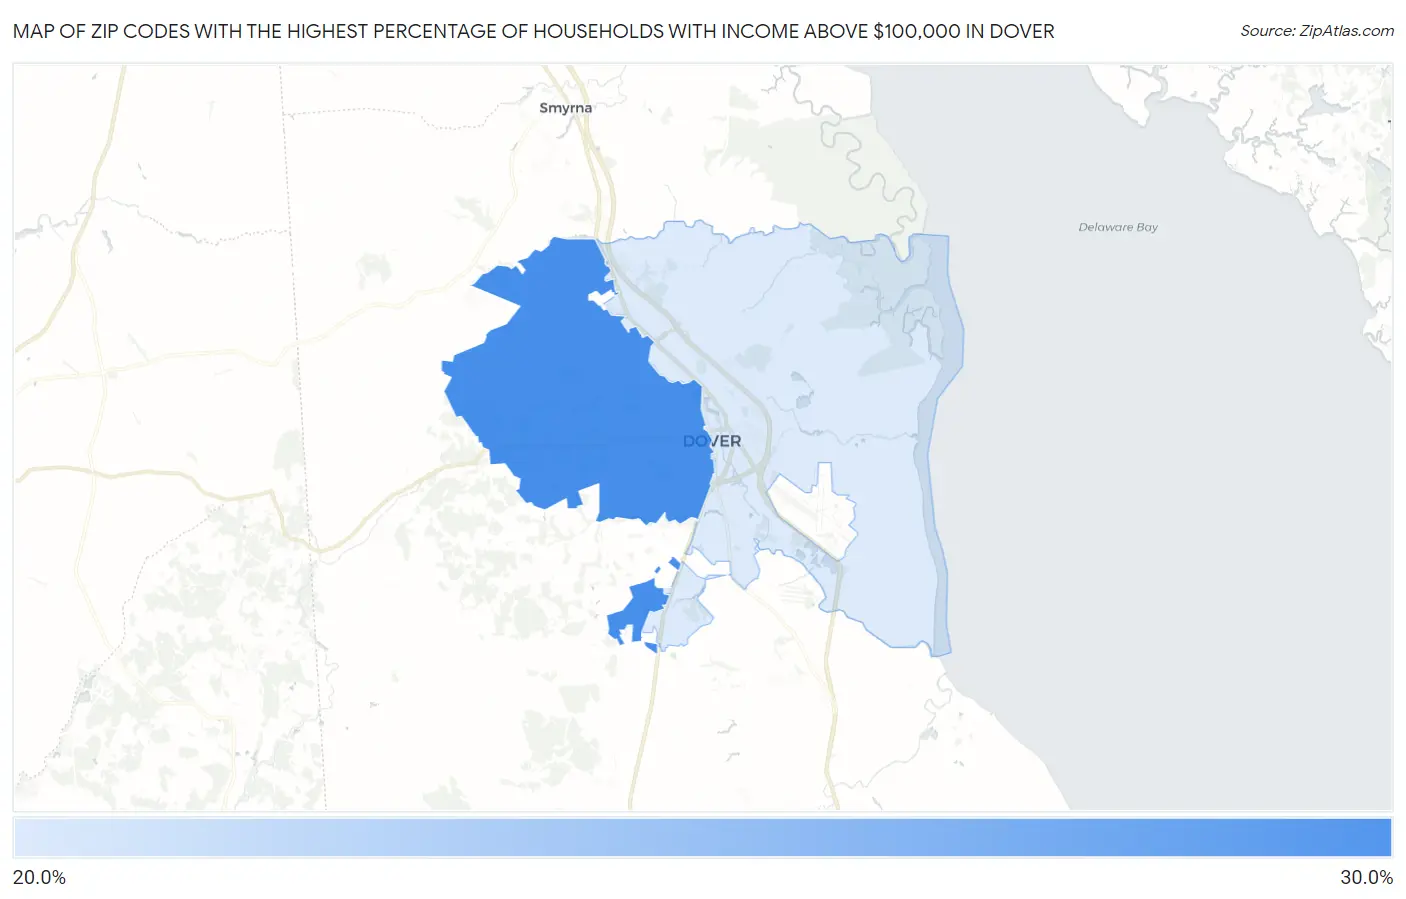
Map of Zip Codes with the Highest Percentage of Households with Income Above $100,000 in Dover
25.8%
29.1%
Zip Codes with the Highest Percentage of Households with Income Above $100,000 in Dover, DE
| Zip Code | Households with Income > $100k | vs State | vs National | |
| 1. | 19904 | 29.1% | 38.6%(-9.50)#48 | 37.3%(-8.20)#16,152 |
| 2. | 19901 | 25.8% | 38.6%(-12.8)#54 | 37.3%(-11.5)#19,042 |
1
Common Questions
What are the Top Zip Codes with the Highest Percentage of Households with Income Above $100,000 in Dover, DE?
Top Zip Codes with the Highest Percentage of Households with Income Above $100,000 in Dover, DE are:
What zip code has the Highest Percentage of Households with Income Above $100,000 in Dover, DE?
19904 has the Highest Percentage of Households with Income Above $100,000 in Dover, DE with 29.1%.
What is the Percentage of Households with Income Above $100,000 in Dover, DE?
Percentage of Households with Income Above $100,000 in Dover is 22.8%.
What is the Percentage of Households with Income Above $100,000 in Delaware?
Percentage of Households with Income Above $100,000 in Delaware is 38.6%.
What is the Percentage of Households with Income Above $100,000 in the United States?
Percentage of Households with Income Above $100,000 in the United States is 37.3%.