Zip Codes with the Highest Percentage of Population Employed in Agriculture, Fishing & Hunting in Whittier, CA
RELATED REPORTS & OPTIONS
Agriculture, Fishing & Hunting
Whittier
Compare Zip Codes
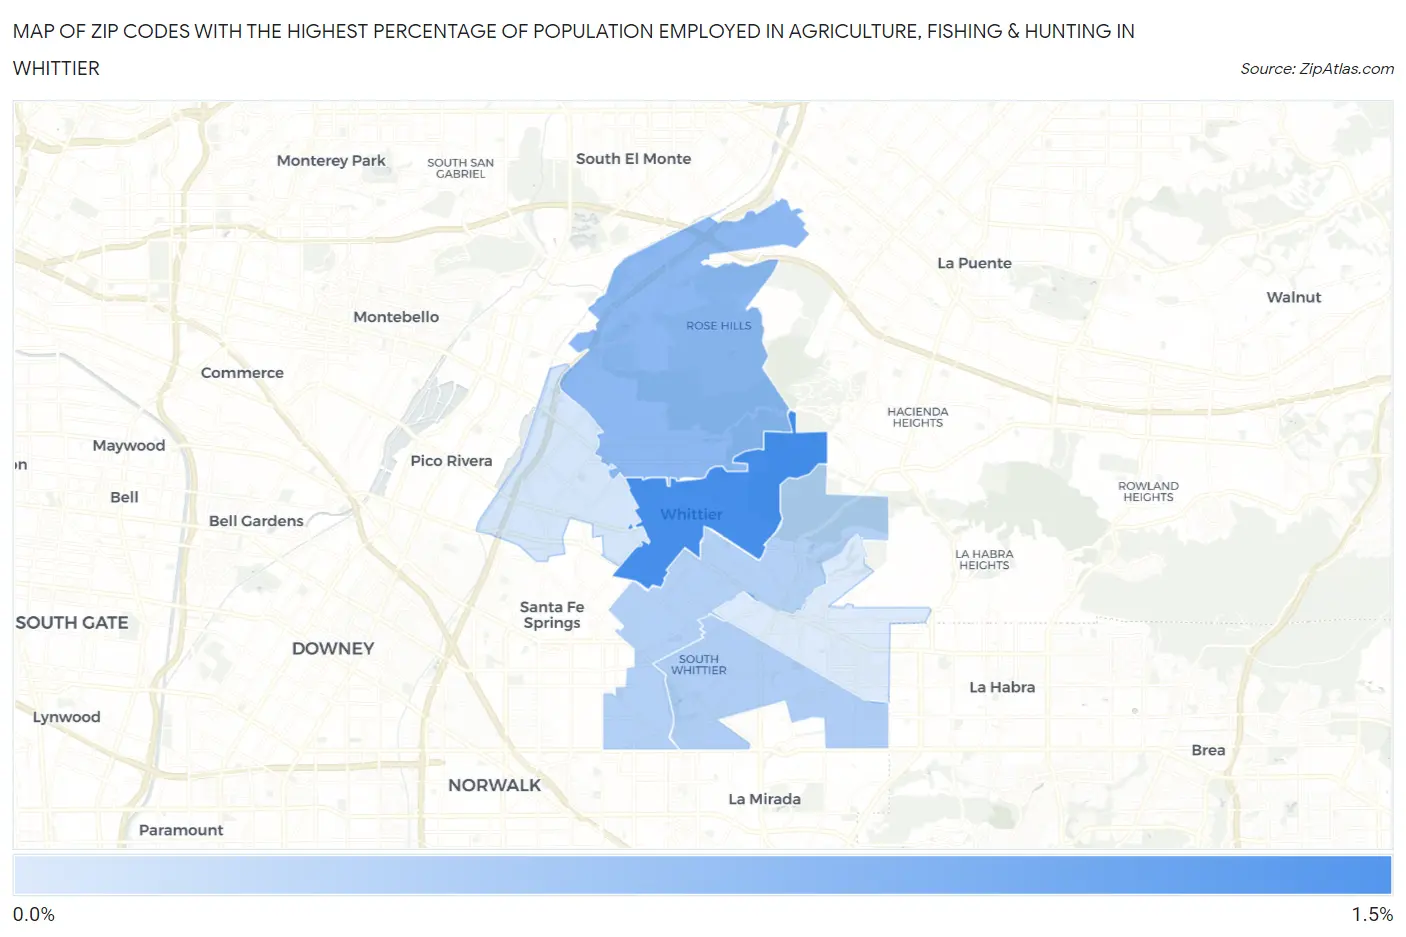
Map of Zip Codes with the Highest Percentage of Population Employed in Agriculture, Fishing & Hunting in Whittier
0.0%
1.5%
Zip Codes with the Highest Percentage of Population Employed in Agriculture, Fishing & Hunting in Whittier, CA
| Zip Code | % Employed | vs State | vs National | |
| 1. | 90602 | 1.0% | 2.0%(-0.983)#727 | 1.2%(-0.197)#16,206 |
| 2. | 90601 | 0.59% | 2.0%(-1.40)#904 | 1.2%(-0.610)#18,556 |
| 3. | 90604 | 0.40% | 2.0%(-1.59)#1,040 | 1.2%(-0.803)#20,198 |
| 4. | 90605 | 0.36% | 2.0%(-1.63)#1,069 | 1.2%(-0.841)#20,570 |
| 5. | 90606 | 0.17% | 2.0%(-1.81)#1,250 | 1.2%(-1.03)#22,687 |
| 6. | 90603 | 0.12% | 2.0%(-1.87)#1,308 | 1.2%(-1.08)#23,437 |
1
Common Questions
What are the Top 5 Zip Codes with the Highest Percentage of Population Employed in Agriculture, Fishing & Hunting in Whittier, CA?
Top 5 Zip Codes with the Highest Percentage of Population Employed in Agriculture, Fishing & Hunting in Whittier, CA are:
What zip code has the Highest Percentage of Population Employed in Agriculture, Fishing & Hunting in Whittier, CA?
90602 has the Highest Percentage of Population Employed in Agriculture, Fishing & Hunting in Whittier, CA with 1.0%.
What is the Percentage of Population Employed in Agriculture, Fishing & Hunting in Whittier, CA?
Percentage of Population Employed in Agriculture, Fishing & Hunting in Whittier is 0.62%.
What is the Percentage of Population Employed in Agriculture, Fishing & Hunting in California?
Percentage of Population Employed in Agriculture, Fishing & Hunting in California is 2.0%.
What is the Percentage of Population Employed in Agriculture, Fishing & Hunting in the United States?
Percentage of Population Employed in Agriculture, Fishing & Hunting in the United States is 1.2%.