Zip Codes with the Highest Percentage of Population Employed in Office & Administration in Newport Beach, CA
RELATED REPORTS & OPTIONS
Office & Administration
Newport Beach
Compare Zip Codes
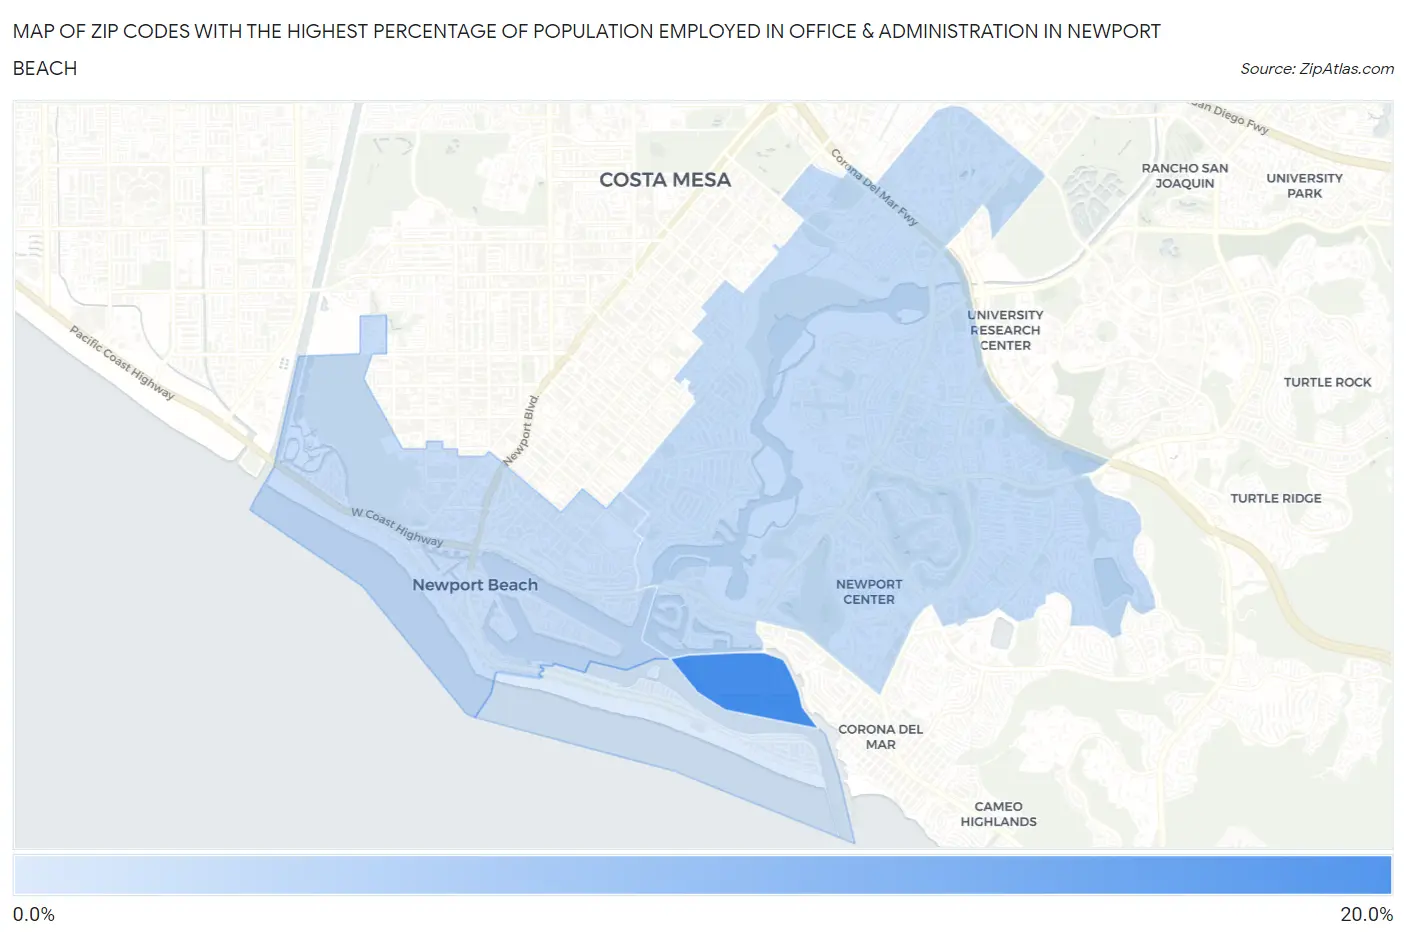
Map of Zip Codes with the Highest Percentage of Population Employed in Office & Administration in Newport Beach
4.0%
18.6%
Zip Codes with the Highest Percentage of Population Employed in Office & Administration in Newport Beach, CA
| Zip Code | % Employed | vs State | vs National | |
| 1. | 92662 | 18.6% | 10.5%(+8.10)#65 | 10.9%(+7.74)#2,111 |
| 2. | 92660 | 6.4% | 10.5%(-4.12)#1,340 | 10.9%(-4.47)#26,276 |
| 3. | 92663 | 6.0% | 10.5%(-4.47)#1,372 | 10.9%(-4.83)#26,812 |
| 4. | 92661 | 4.0% | 10.5%(-6.48)#1,508 | 10.9%(-6.83)#28,982 |
1
Common Questions
What are the Top 3 Zip Codes with the Highest Percentage of Population Employed in Office & Administration in Newport Beach, CA?
Top 3 Zip Codes with the Highest Percentage of Population Employed in Office & Administration in Newport Beach, CA are:
What zip code has the Highest Percentage of Population Employed in Office & Administration in Newport Beach, CA?
92662 has the Highest Percentage of Population Employed in Office & Administration in Newport Beach, CA with 18.6%.
What is the Percentage of Population Employed in Office & Administration in Newport Beach, CA?
Percentage of Population Employed in Office & Administration in Newport Beach is 6.3%.
What is the Percentage of Population Employed in Office & Administration in California?
Percentage of Population Employed in Office & Administration in California is 10.5%.
What is the Percentage of Population Employed in Office & Administration in the United States?
Percentage of Population Employed in Office & Administration in the United States is 10.9%.