Zip Codes with the Highest Percentage of Population Employed in Office & Administration in Moraga, CA
RELATED REPORTS & OPTIONS
Office & Administration
Moraga
Compare Zip Codes
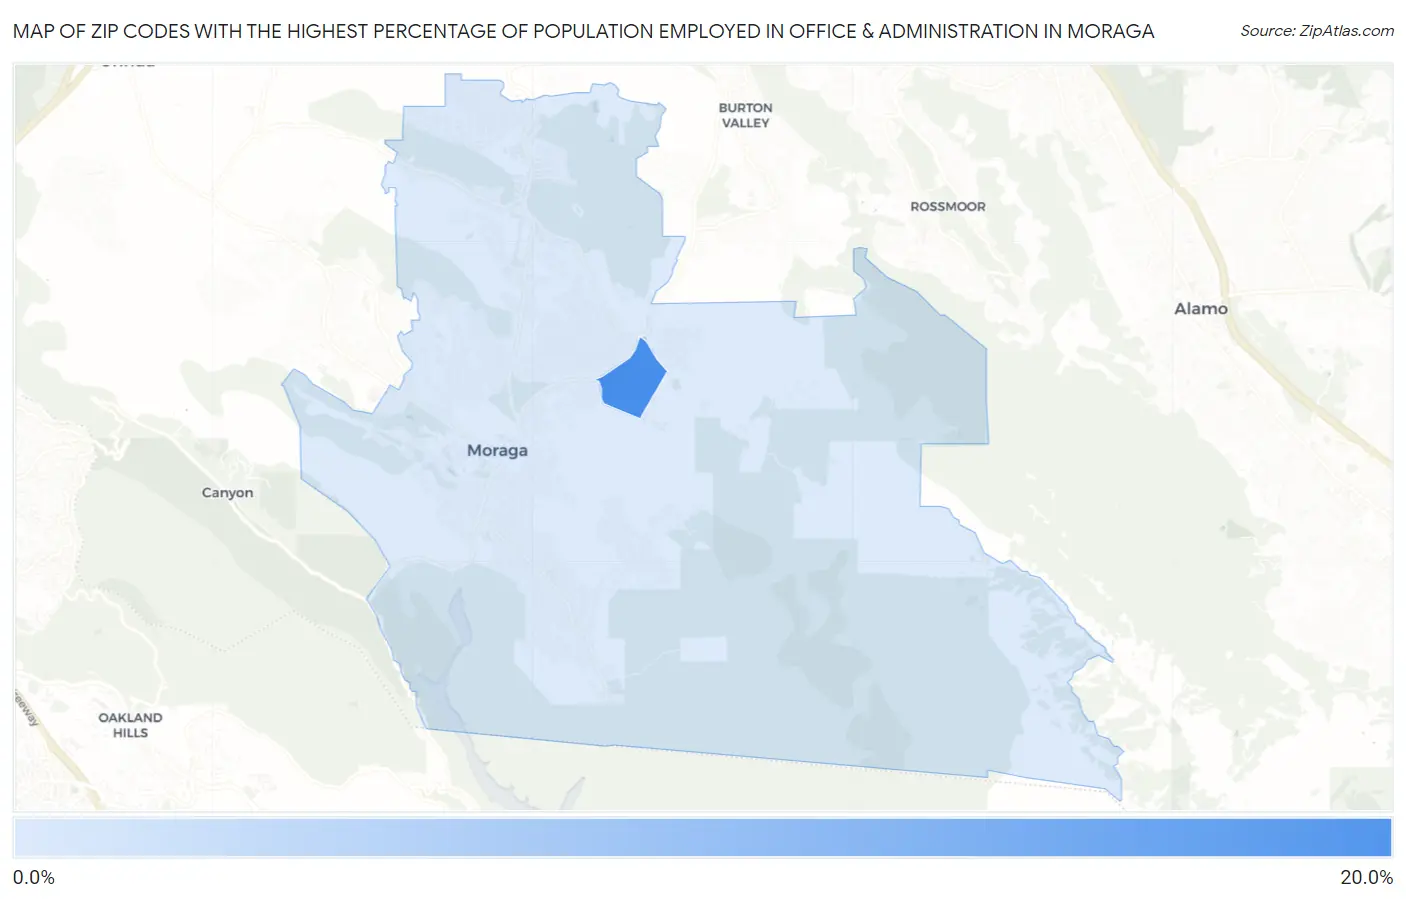
Map of Zip Codes with the Highest Percentage of Population Employed in Office & Administration in Moraga
5.9%
19.2%
Zip Codes with the Highest Percentage of Population Employed in Office & Administration in Moraga, CA
| Zip Code | % Employed | vs State | vs National | |
| 1. | 94575 | 19.2% | 10.5%(+8.72)#60 | 10.9%(+8.36)#1,902 |
| 2. | 94556 | 5.9% | 10.5%(-4.64)#1,391 | 10.9%(-4.99)#27,051 |
1
Common Questions
What are the Top Zip Codes with the Highest Percentage of Population Employed in Office & Administration in Moraga, CA?
Top Zip Codes with the Highest Percentage of Population Employed in Office & Administration in Moraga, CA are:
What zip code has the Highest Percentage of Population Employed in Office & Administration in Moraga, CA?
94575 has the Highest Percentage of Population Employed in Office & Administration in Moraga, CA with 19.2%.
What is the Percentage of Population Employed in Office & Administration in Moraga, CA?
Percentage of Population Employed in Office & Administration in Moraga is 6.5%.
What is the Percentage of Population Employed in Office & Administration in California?
Percentage of Population Employed in Office & Administration in California is 10.5%.
What is the Percentage of Population Employed in Office & Administration in the United States?
Percentage of Population Employed in Office & Administration in the United States is 10.9%.