Zip Codes with the Highest Percentage of Population Employed in Arts, Entertainment & Recreation in Tucson, AZ
RELATED REPORTS & OPTIONS
Arts, Entertainment & Recreation
Tucson
Compare Zip Codes
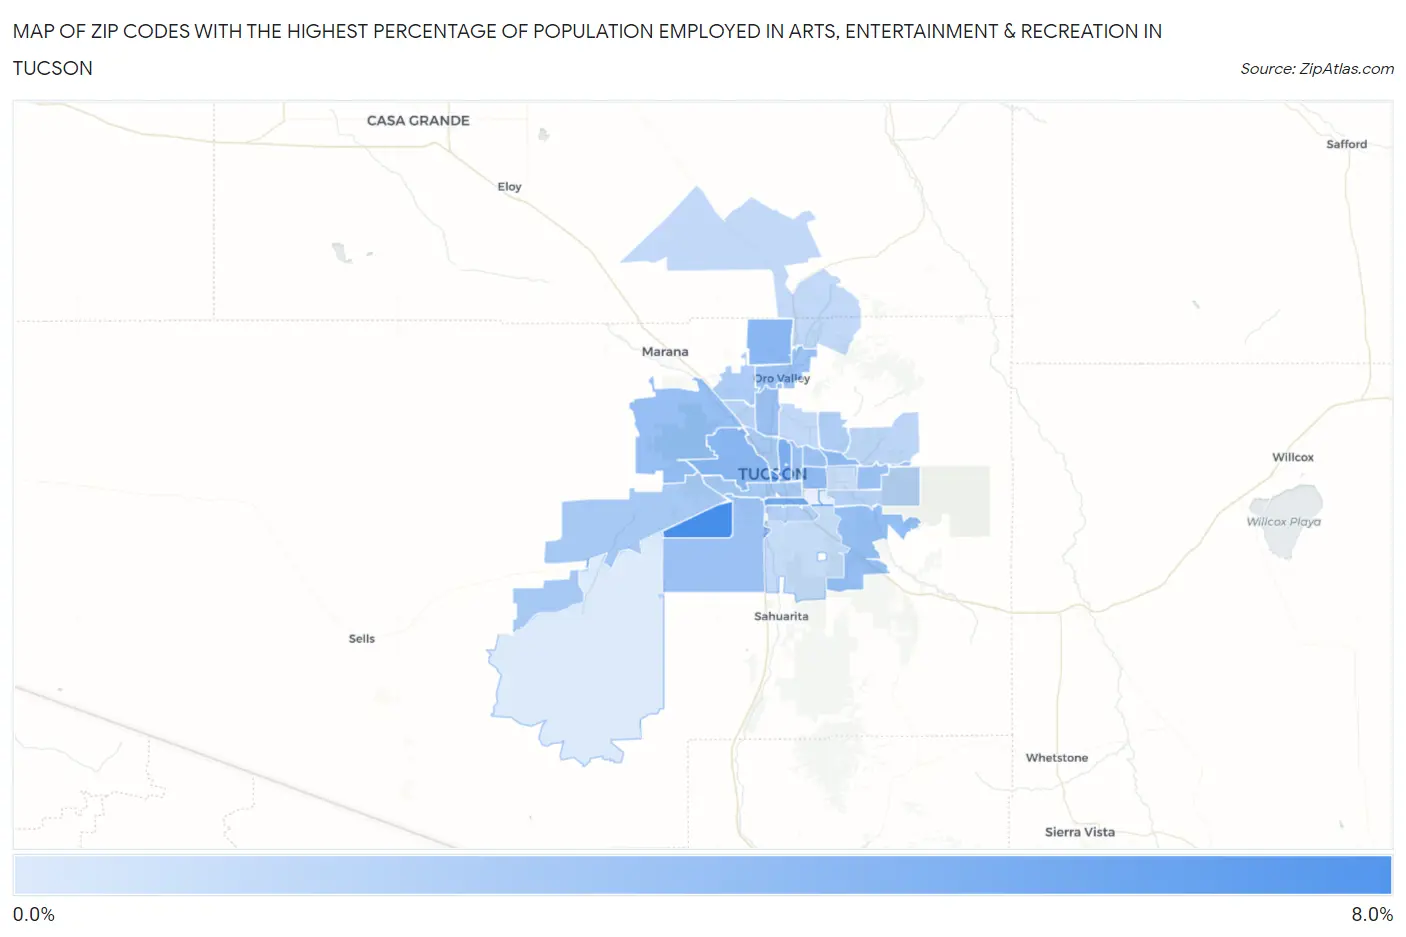
Map of Zip Codes with the Highest Percentage of Population Employed in Arts, Entertainment & Recreation in Tucson
0.0%
8.0%
Zip Codes with the Highest Percentage of Population Employed in Arts, Entertainment & Recreation in Tucson, AZ
| Zip Code | % Employed | vs State | vs National | |
| 1. | 85757 | 6.1% | 2.3%(+3.76)#37 | 2.1%(+3.99)#1,667 |
| 2. | 85701 | 4.8% | 2.3%(+2.45)#49 | 2.1%(+2.68)#2,466 |
| 3. | 85714 | 4.2% | 2.3%(+1.84)#64 | 2.1%(+2.07)#3,138 |
| 4. | 85719 | 3.9% | 2.3%(+1.62)#69 | 2.1%(+1.85)#3,429 |
| 5. | 85755 | 3.4% | 2.3%(+1.08)#81 | 2.1%(+1.31)#4,379 |
| 6. | 85745 | 3.4% | 2.3%(+1.05)#82 | 2.1%(+1.27)#4,451 |
| 7. | 85711 | 3.1% | 2.3%(+0.806)#91 | 2.1%(+1.03)#5,021 |
| 8. | 85715 | 3.1% | 2.3%(+0.797)#92 | 2.1%(+1.03)#5,043 |
| 9. | 85747 | 2.9% | 2.3%(+0.609)#106 | 2.1%(+0.837)#5,596 |
| 10. | 85743 | 2.8% | 2.3%(+0.500)#112 | 2.1%(+0.728)#5,951 |
| 11. | 85737 | 2.8% | 2.3%(+0.440)#116 | 2.1%(+0.668)#6,184 |
| 12. | 85748 | 2.7% | 2.3%(+0.376)#127 | 2.1%(+0.604)#6,409 |
| 13. | 85716 | 2.7% | 2.3%(+0.371)#128 | 2.1%(+0.599)#6,431 |
| 14. | 85704 | 2.7% | 2.3%(+0.344)#131 | 2.1%(+0.572)#6,545 |
| 15. | 85746 | 2.7% | 2.3%(+0.343)#132 | 2.1%(+0.570)#6,551 |
| 16. | 85712 | 2.6% | 2.3%(+0.278)#137 | 2.1%(+0.506)#6,805 |
| 17. | 85705 | 2.2% | 2.3%(-0.105)#164 | 2.1%(+0.123)#8,613 |
| 18. | 85735 | 2.2% | 2.3%(-0.148)#168 | 2.1%(+0.080)#8,848 |
| 19. | 85713 | 2.1% | 2.3%(-0.178)#173 | 2.1%(+0.050)#9,034 |
| 20. | 85742 | 1.9% | 2.3%(-0.363)#194 | 2.1%(-0.135)#10,096 |
| 21. | 85750 | 1.8% | 2.3%(-0.504)#205 | 2.1%(-0.276)#10,972 |
| 22. | 85706 | 1.7% | 2.3%(-0.614)#218 | 2.1%(-0.386)#11,762 |
| 23. | 85730 | 1.5% | 2.3%(-0.768)#237 | 2.1%(-0.540)#12,933 |
| 24. | 85741 | 1.5% | 2.3%(-0.778)#240 | 2.1%(-0.550)#13,019 |
| 25. | 85749 | 1.4% | 2.3%(-0.937)#254 | 2.1%(-0.710)#14,193 |
| 26. | 85739 | 1.2% | 2.3%(-1.11)#270 | 2.1%(-0.881)#15,470 |
| 27. | 85718 | 1.2% | 2.3%(-1.15)#274 | 2.1%(-0.924)#15,806 |
| 28. | 85756 | 0.98% | 2.3%(-1.33)#284 | 2.1%(-1.10)#17,094 |
| 29. | 85710 | 0.90% | 2.3%(-1.41)#287 | 2.1%(-1.19)#17,706 |
| 30. | 85736 | 0.084% | 2.3%(-2.23)#310 | 2.1%(-2.00)#22,573 |
1
Common Questions
What are the Top 10 Zip Codes with the Highest Percentage of Population Employed in Arts, Entertainment & Recreation in Tucson, AZ?
Top 10 Zip Codes with the Highest Percentage of Population Employed in Arts, Entertainment & Recreation in Tucson, AZ are:
What zip code has the Highest Percentage of Population Employed in Arts, Entertainment & Recreation in Tucson, AZ?
85757 has the Highest Percentage of Population Employed in Arts, Entertainment & Recreation in Tucson, AZ with 6.1%.
What is the Percentage of Population Employed in Arts, Entertainment & Recreation in Tucson, AZ?
Percentage of Population Employed in Arts, Entertainment & Recreation in Tucson is 2.4%.
What is the Percentage of Population Employed in Arts, Entertainment & Recreation in Arizona?
Percentage of Population Employed in Arts, Entertainment & Recreation in Arizona is 2.3%.
What is the Percentage of Population Employed in Arts, Entertainment & Recreation in the United States?
Percentage of Population Employed in Arts, Entertainment & Recreation in the United States is 2.1%.