Zip Codes with the Highest Percentage of Population Employed in Arts, Entertainment & Recreation in Prescott Valley, AZ
RELATED REPORTS & OPTIONS
Arts, Entertainment & Recreation
Prescott Valley
Compare Zip Codes
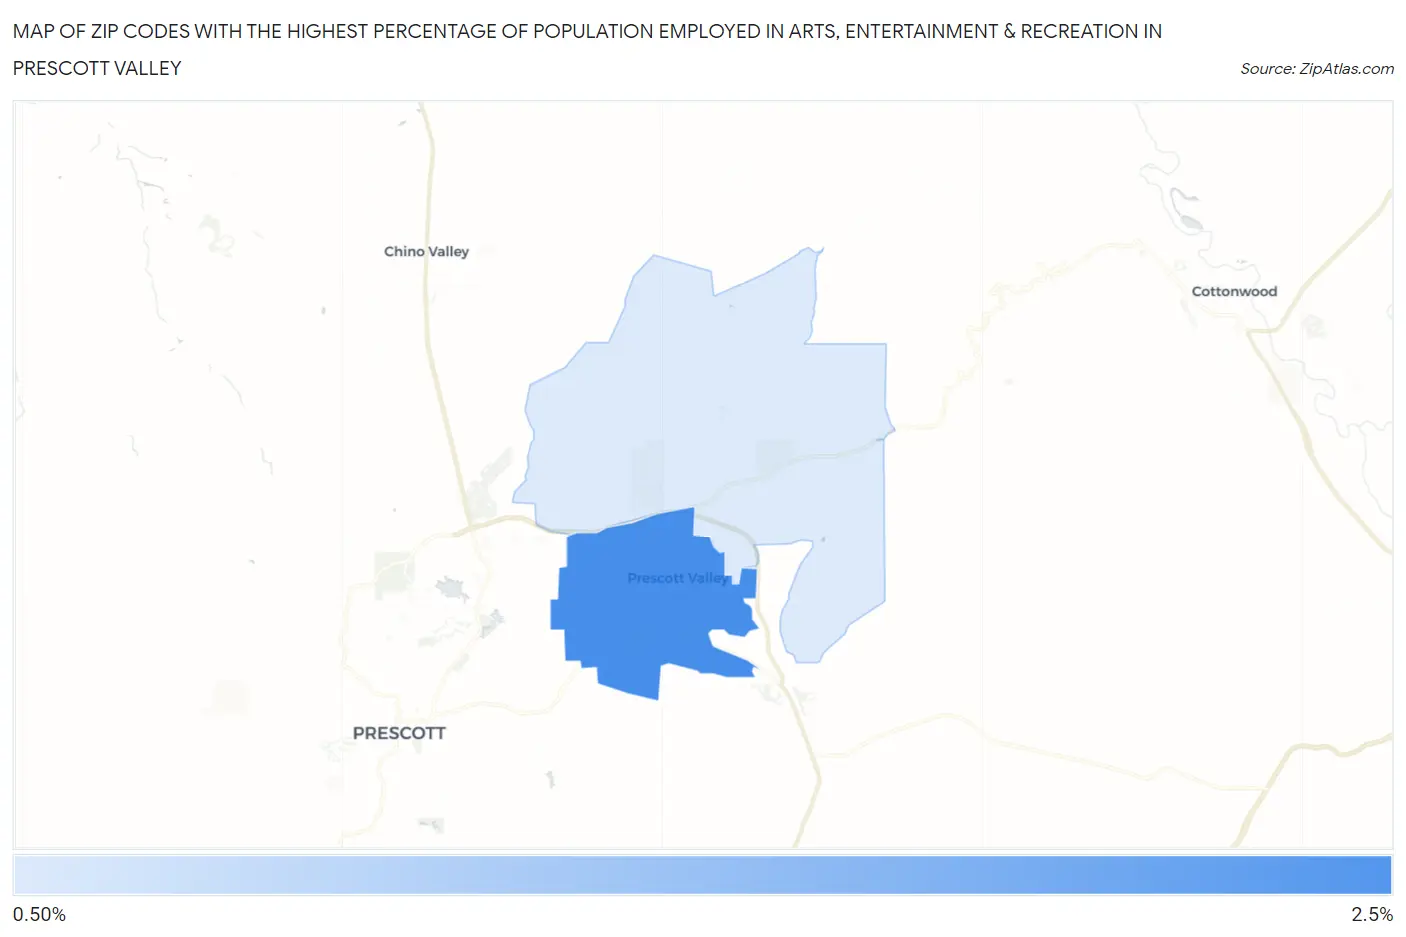
Map of Zip Codes with the Highest Percentage of Population Employed in Arts, Entertainment & Recreation in Prescott Valley
0.84%
2.1%
Zip Codes with the Highest Percentage of Population Employed in Arts, Entertainment & Recreation in Prescott Valley, AZ
| Zip Code | % Employed | vs State | vs National | |
| 1. | 86314 | 2.1% | 2.3%(-0.235)#178 | 2.1%(-0.008)#9,344 |
| 2. | 86315 | 0.84% | 2.3%(-1.47)#290 | 2.1%(-1.24)#18,137 |
1
Common Questions
What are the Top Zip Codes with the Highest Percentage of Population Employed in Arts, Entertainment & Recreation in Prescott Valley, AZ?
Top Zip Codes with the Highest Percentage of Population Employed in Arts, Entertainment & Recreation in Prescott Valley, AZ are:
What zip code has the Highest Percentage of Population Employed in Arts, Entertainment & Recreation in Prescott Valley, AZ?
86314 has the Highest Percentage of Population Employed in Arts, Entertainment & Recreation in Prescott Valley, AZ with 2.1%.
What is the Percentage of Population Employed in Arts, Entertainment & Recreation in Prescott Valley, AZ?
Percentage of Population Employed in Arts, Entertainment & Recreation in Prescott Valley is 1.8%.
What is the Percentage of Population Employed in Arts, Entertainment & Recreation in Arizona?
Percentage of Population Employed in Arts, Entertainment & Recreation in Arizona is 2.3%.
What is the Percentage of Population Employed in Arts, Entertainment & Recreation in the United States?
Percentage of Population Employed in Arts, Entertainment & Recreation in the United States is 2.1%.