Zip Codes with the Highest Percentage of Population Employed in Arts, Entertainment & Recreation in Green Valley, AZ
RELATED REPORTS & OPTIONS
Arts, Entertainment & Recreation
Green Valley
Compare Zip Codes
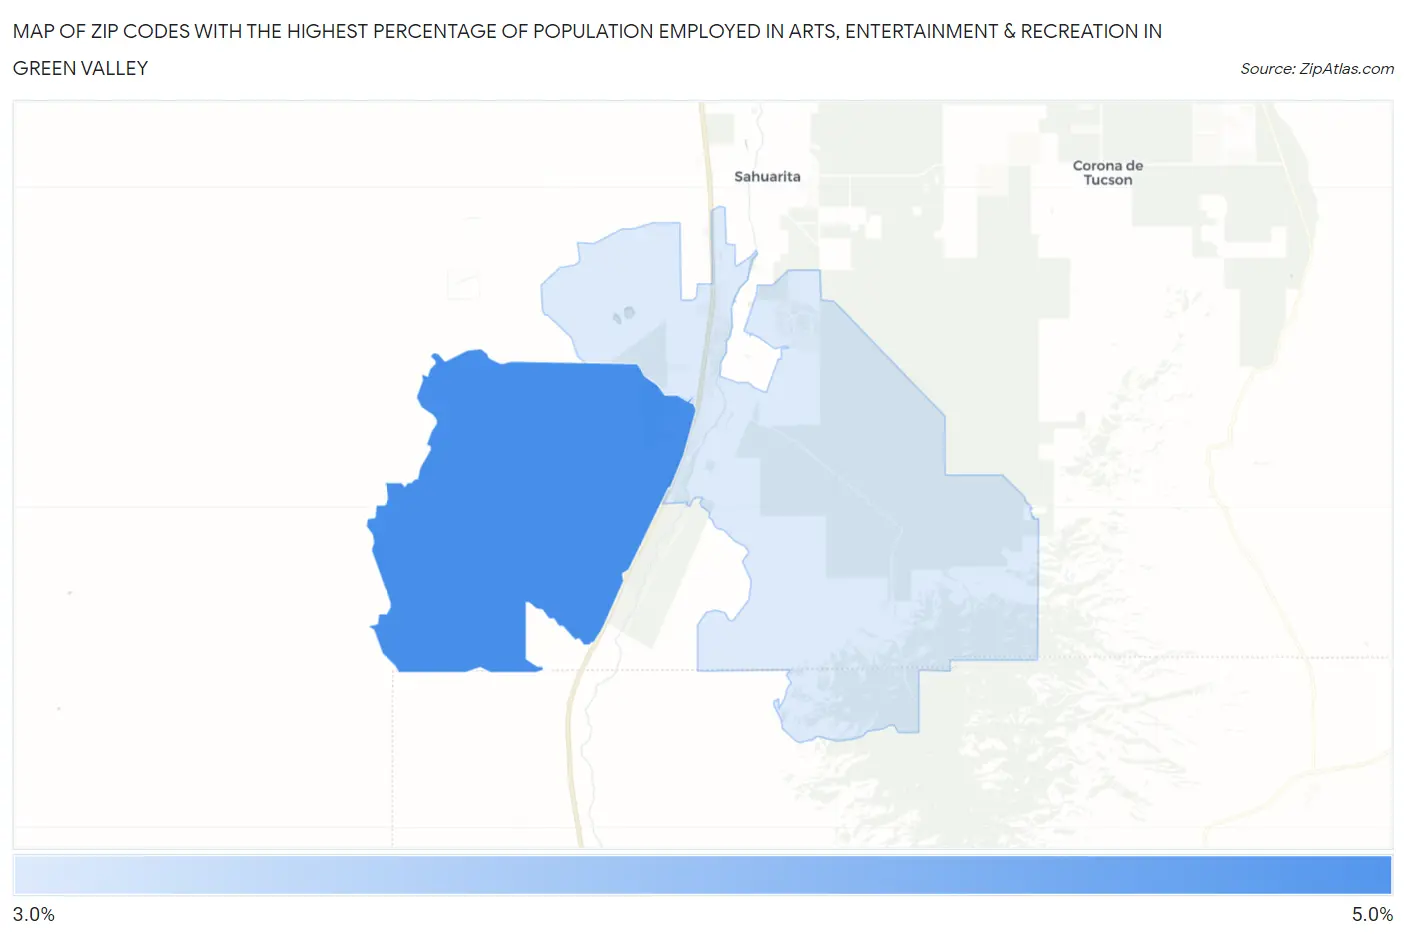
Map of Zip Codes with the Highest Percentage of Population Employed in Arts, Entertainment & Recreation in Green Valley
3.9%
4.4%
Zip Codes with the Highest Percentage of Population Employed in Arts, Entertainment & Recreation in Green Valley, AZ
| Zip Code | % Employed | vs State | vs National | |
| 1. | 85622 | 4.4% | 2.3%(+2.06)#55 | 2.1%(+2.29)#2,873 |
| 2. | 85614 | 3.9% | 2.3%(+1.58)#70 | 2.1%(+1.80)#3,505 |
1
Common Questions
What are the Top Zip Codes with the Highest Percentage of Population Employed in Arts, Entertainment & Recreation in Green Valley, AZ?
Top Zip Codes with the Highest Percentage of Population Employed in Arts, Entertainment & Recreation in Green Valley, AZ are:
What zip code has the Highest Percentage of Population Employed in Arts, Entertainment & Recreation in Green Valley, AZ?
85622 has the Highest Percentage of Population Employed in Arts, Entertainment & Recreation in Green Valley, AZ with 4.4%.
What is the Percentage of Population Employed in Arts, Entertainment & Recreation in Green Valley, AZ?
Percentage of Population Employed in Arts, Entertainment & Recreation in Green Valley is 6.3%.
What is the Percentage of Population Employed in Arts, Entertainment & Recreation in Arizona?
Percentage of Population Employed in Arts, Entertainment & Recreation in Arizona is 2.3%.
What is the Percentage of Population Employed in Arts, Entertainment & Recreation in the United States?
Percentage of Population Employed in Arts, Entertainment & Recreation in the United States is 2.1%.