Zip Codes with the Highest Percentage of Population with a Degree in Liberal Arts and History in North Little Rock, AR
RELATED REPORTS & OPTIONS
Liberal Arts and History
North Little Rock
Compare Zip Codes
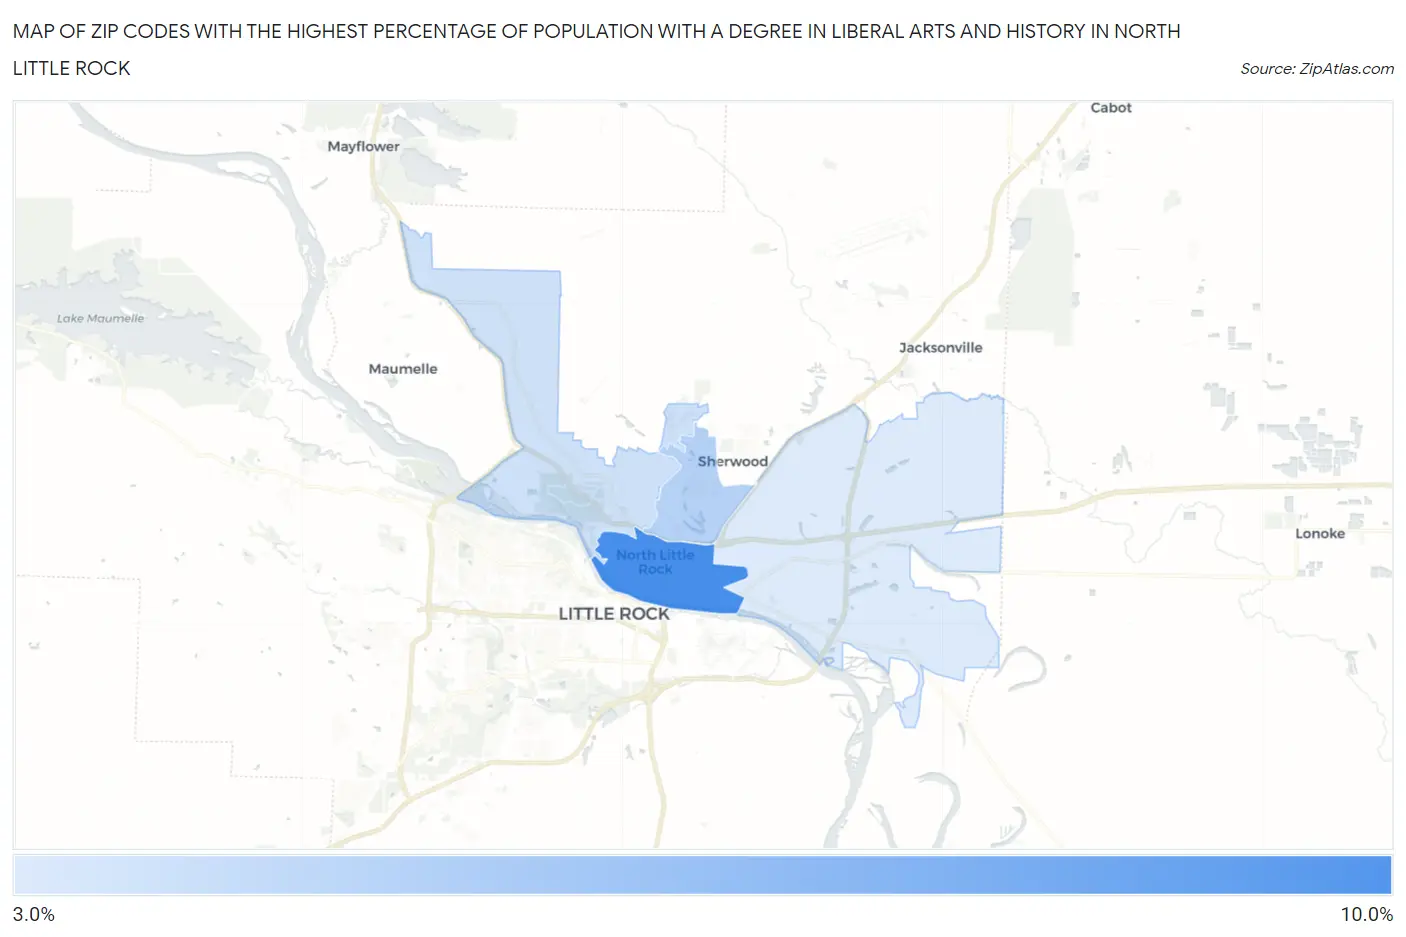
Map of Zip Codes with the Highest Percentage of Population with a Degree in Liberal Arts and History in North Little Rock
3.7%
9.3%
Zip Codes with the Highest Percentage of Population with a Degree in Liberal Arts and History in North Little Rock, AR
| Zip Code | % Graduates | vs State | vs National | |
| 1. | 72114 | 9.3% | 4.9%(+4.35)#68 | 4.9%(+4.38)#3,645 |
| 2. | 72116 | 5.1% | 4.9%(+0.212)#164 | 4.9%(+0.240)#11,002 |
| 3. | 72118 | 4.2% | 4.9%(-0.651)#198 | 4.9%(-0.623)#13,822 |
| 4. | 72117 | 3.7% | 4.9%(-1.16)#216 | 4.9%(-1.13)#15,741 |
1
Common Questions
What are the Top 3 Zip Codes with the Highest Percentage of Population with a Degree in Liberal Arts and History in North Little Rock, AR?
Top 3 Zip Codes with the Highest Percentage of Population with a Degree in Liberal Arts and History in North Little Rock, AR are:
What zip code has the Highest Percentage of Population with a Degree in Liberal Arts and History in North Little Rock, AR?
72114 has the Highest Percentage of Population with a Degree in Liberal Arts and History in North Little Rock, AR with 9.3%.
What is the Percentage of Population with a Degree in Liberal Arts and History in North Little Rock, AR?
Percentage of Population with a Degree in Liberal Arts and History in North Little Rock is 5.3%.
What is the Percentage of Population with a Degree in Liberal Arts and History in Arkansas?
Percentage of Population with a Degree in Liberal Arts and History in Arkansas is 4.9%.
What is the Percentage of Population with a Degree in Liberal Arts and History in the United States?
Percentage of Population with a Degree in Liberal Arts and History in the United States is 4.9%.