Zip Codes with the Highest Percentage of Population Employed in Security & Protection in Gillette, WY
RELATED REPORTS & OPTIONS
Security & Protection
Gillette
Compare Zip Codes
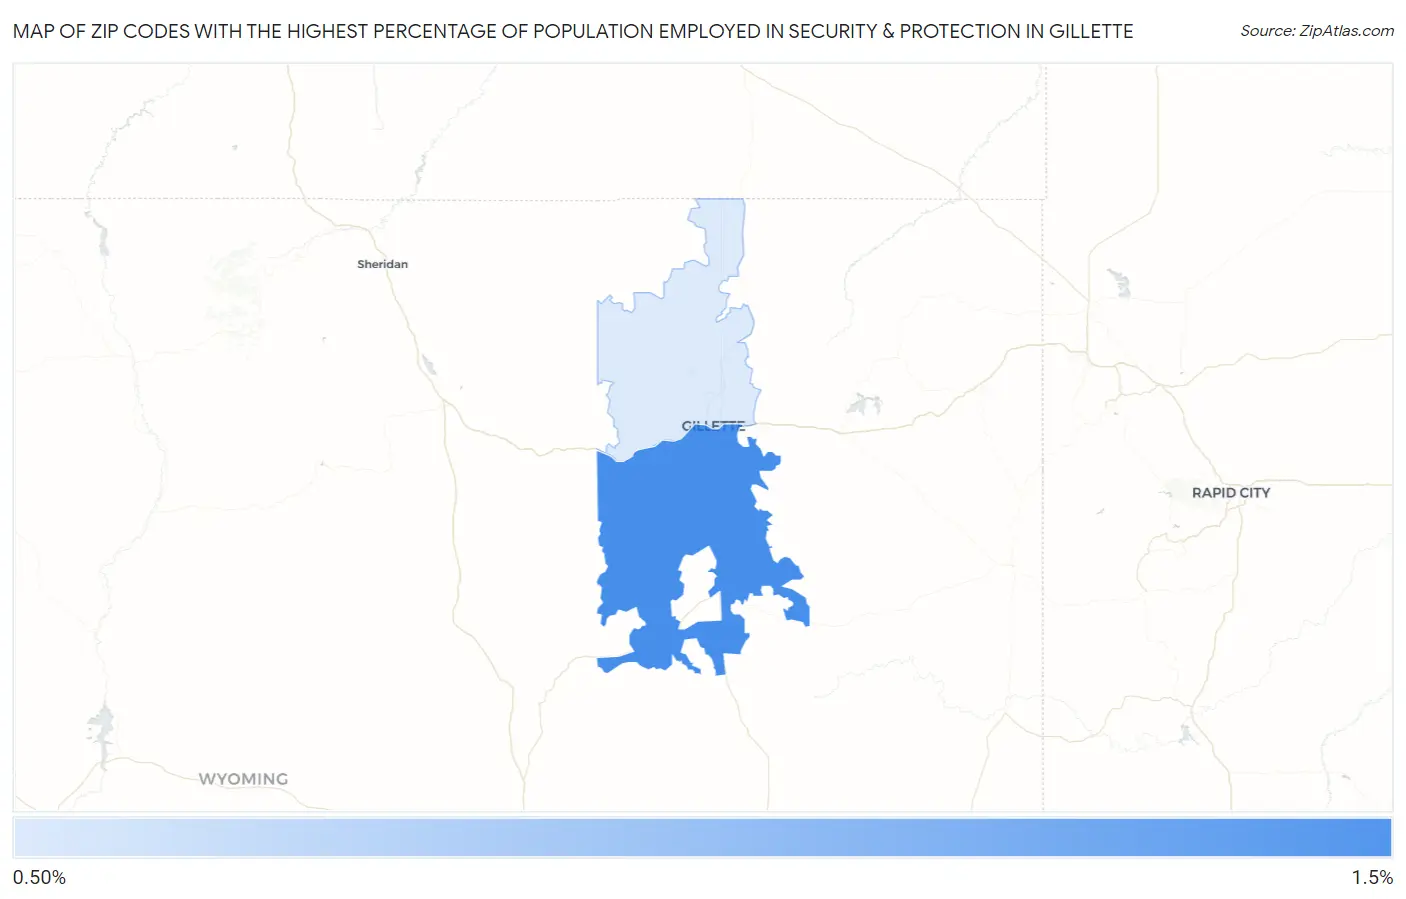
Map of Zip Codes with the Highest Percentage of Population Employed in Security & Protection in Gillette
0.94%
1.0%
Zip Codes with the Highest Percentage of Population Employed in Security & Protection in Gillette, WY
| Zip Code | % Employed | vs State | vs National | |
| 1. | 82718 | 1.0% | 1.9%(-0.903)#66 | 2.1%(-1.10)#19,708 |
| 2. | 82716 | 0.94% | 1.9%(-1.01)#70 | 2.1%(-1.21)#20,493 |
1
Common Questions
What are the Top Zip Codes with the Highest Percentage of Population Employed in Security & Protection in Gillette, WY?
Top Zip Codes with the Highest Percentage of Population Employed in Security & Protection in Gillette, WY are:
What zip code has the Highest Percentage of Population Employed in Security & Protection in Gillette, WY?
82718 has the Highest Percentage of Population Employed in Security & Protection in Gillette, WY with 1.0%.
What is the Percentage of Population Employed in Security & Protection in Gillette, WY?
Percentage of Population Employed in Security & Protection in Gillette is 1.2%.
What is the Percentage of Population Employed in Security & Protection in Wyoming?
Percentage of Population Employed in Security & Protection in Wyoming is 1.9%.
What is the Percentage of Population Employed in Security & Protection in the United States?
Percentage of Population Employed in Security & Protection in the United States is 2.1%.