Zip Codes with the Highest Percentage of Population Taking Taxi / Cab to Work in Gillette, WY
RELATED REPORTS & OPTIONS
Taxi / Cab
Gillette
Compare Zip Codes
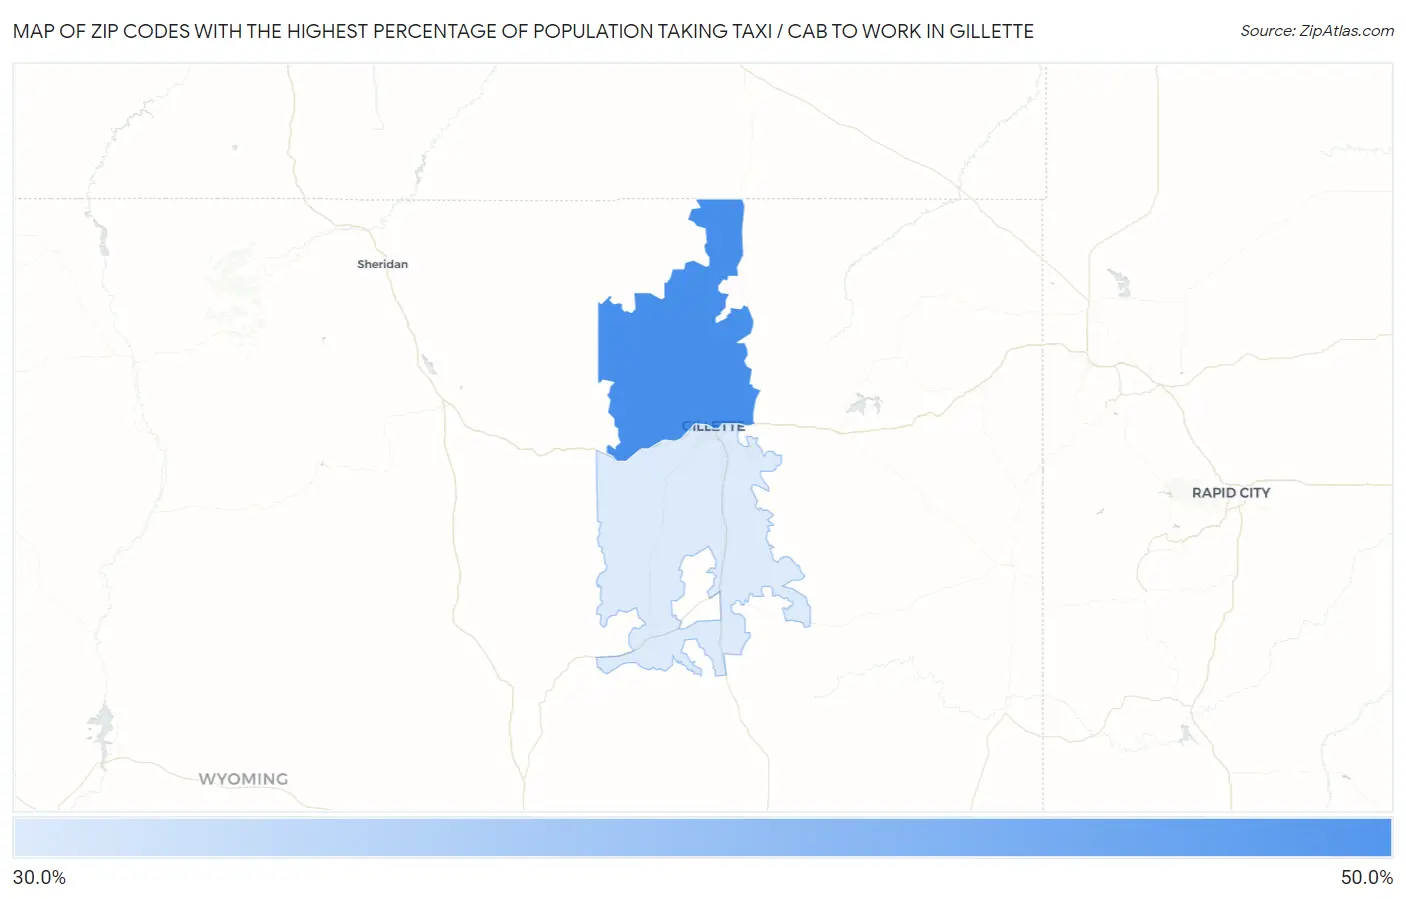
Map of Zip Codes with the Highest Percentage of Population Taking Taxi / Cab to Work in Gillette
30.5%
40.6%
Zip Codes with the Highest Percentage of Population Taking Taxi / Cab to Work in Gillette, WY
| Zip Code | % Take Taxi / Cab | vs State | vs National | |
| 1. | 82716 | 40.6% | 39.5%(+1.10)#17 | 38.2%(+2.40)#6,342 |
| 2. | 82718 | 30.5% | 39.5%(-9.00)#26 | 38.2%(-7.70)#10,746 |
1
Common Questions
What are the Top Zip Codes with the Highest Percentage of Population Taking Taxi / Cab to Work in Gillette, WY?
Top Zip Codes with the Highest Percentage of Population Taking Taxi / Cab to Work in Gillette, WY are:
What zip code has the Highest Percentage of Population Taking Taxi / Cab to Work in Gillette, WY?
82716 has the Highest Percentage of Population Taking Taxi / Cab to Work in Gillette, WY with 40.6%.
What is the Percentage of Population Taking Taxi / Cab to Work in Gillette, WY?
Percentage of Population Taking Taxi / Cab to Work in Gillette is 35.5%.
What is the Percentage of Population Taking Taxi / Cab to Work in Wyoming?
Percentage of Population Taking Taxi / Cab to Work in Wyoming is 39.5%.
What is the Percentage of Population Taking Taxi / Cab to Work in the United States?
Percentage of Population Taking Taxi / Cab to Work in the United States is 38.2%.