Zip Codes with the Highest Percentage of Population Employed in Life, Physical & Social Science in Gillette, WY
RELATED REPORTS & OPTIONS
Life, Physical & Social Science
Gillette
Compare Zip Codes
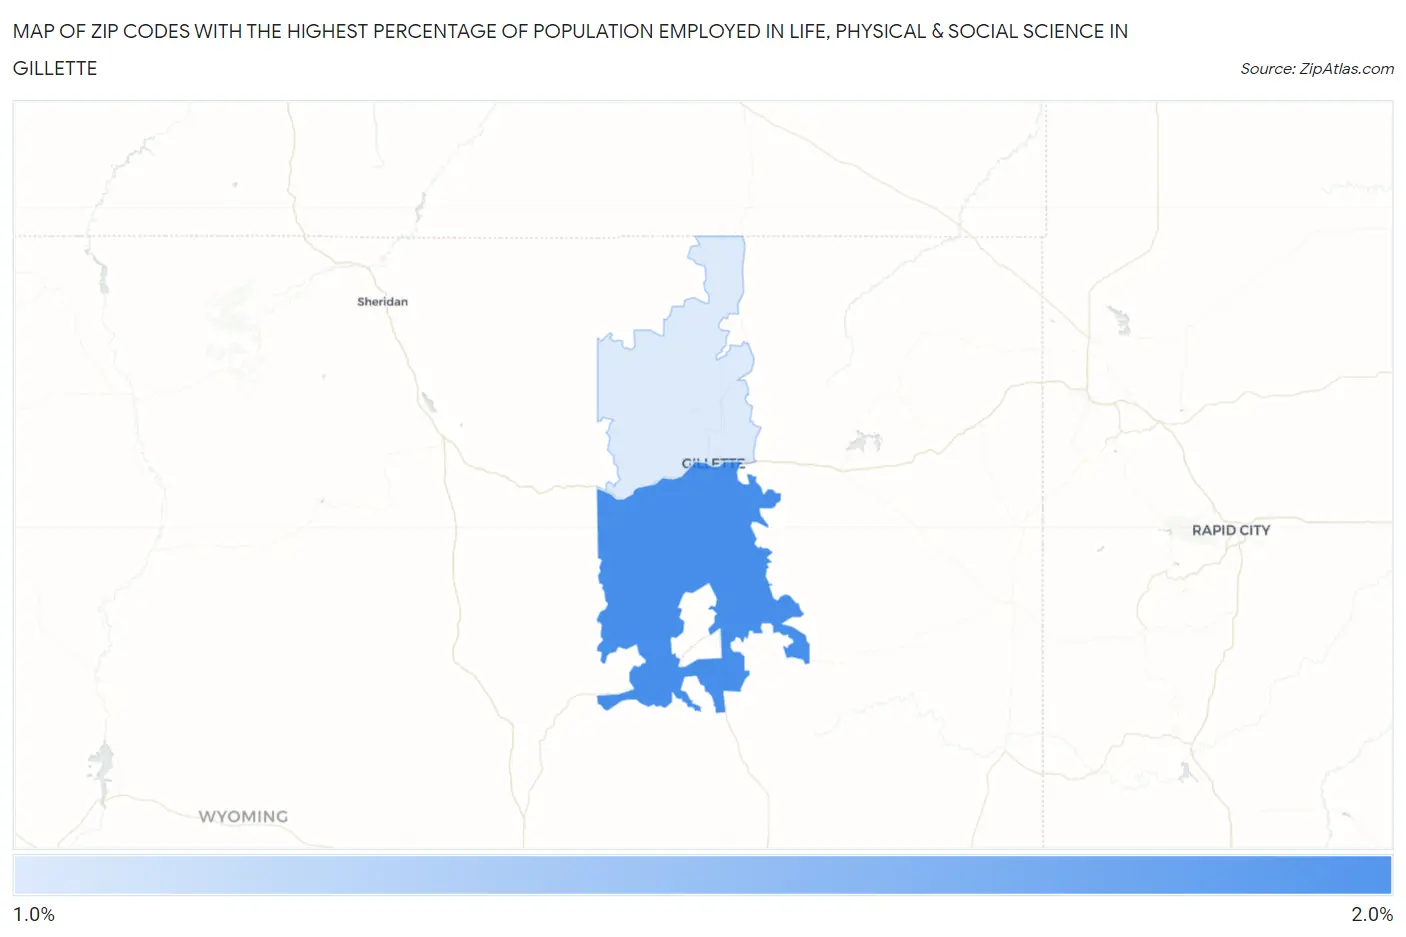
Map of Zip Codes with the Highest Percentage of Population Employed in Life, Physical & Social Science in Gillette
1.6%
1.9%
Zip Codes with the Highest Percentage of Population Employed in Life, Physical & Social Science in Gillette, WY
| Zip Code | % Employed | vs State | vs National | |
| 1. | 82718 | 1.9% | 1.4%(+0.526)#25 | 1.1%(+0.794)#4,027 |
| 2. | 82716 | 1.6% | 1.4%(+0.260)#28 | 1.1%(+0.527)#5,080 |
1
Common Questions
What are the Top Zip Codes with the Highest Percentage of Population Employed in Life, Physical & Social Science in Gillette, WY?
Top Zip Codes with the Highest Percentage of Population Employed in Life, Physical & Social Science in Gillette, WY are:
What zip code has the Highest Percentage of Population Employed in Life, Physical & Social Science in Gillette, WY?
82718 has the Highest Percentage of Population Employed in Life, Physical & Social Science in Gillette, WY with 1.9%.
What is the Percentage of Population Employed in Life, Physical & Social Science in Gillette, WY?
Percentage of Population Employed in Life, Physical & Social Science in Gillette is 1.1%.
What is the Percentage of Population Employed in Life, Physical & Social Science in Wyoming?
Percentage of Population Employed in Life, Physical & Social Science in Wyoming is 1.4%.
What is the Percentage of Population Employed in Life, Physical & Social Science in the United States?
Percentage of Population Employed in Life, Physical & Social Science in the United States is 1.1%.