Zip Codes with the Highest Percentage of Population with a Degree in Liberal Arts and History in Gillette, WY
RELATED REPORTS & OPTIONS
Liberal Arts and History
Gillette
Compare Zip Codes
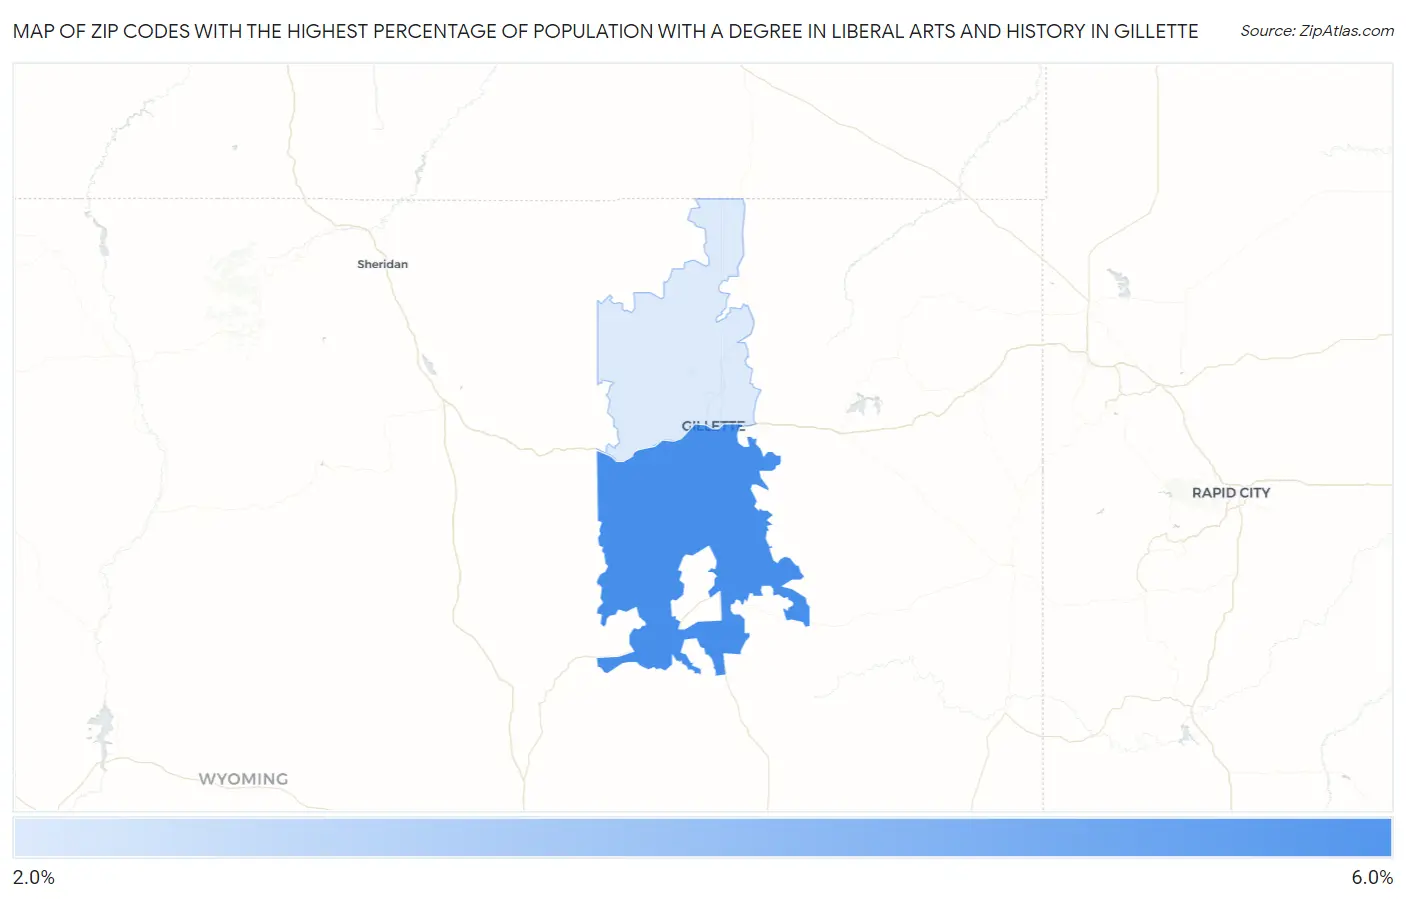
Map of Zip Codes with the Highest Percentage of Population with a Degree in Liberal Arts and History in Gillette
2.8%
5.3%
Zip Codes with the Highest Percentage of Population with a Degree in Liberal Arts and History in Gillette, WY
| Zip Code | % Graduates | vs State | vs National | |
| 1. | 82718 | 5.3% | 4.7%(+0.531)#38 | 4.9%(+0.389)#10,568 |
| 2. | 82716 | 2.8% | 4.7%(-1.93)#66 | 4.9%(-2.07)#19,010 |
1
Common Questions
What are the Top Zip Codes with the Highest Percentage of Population with a Degree in Liberal Arts and History in Gillette, WY?
Top Zip Codes with the Highest Percentage of Population with a Degree in Liberal Arts and History in Gillette, WY are:
What zip code has the Highest Percentage of Population with a Degree in Liberal Arts and History in Gillette, WY?
82718 has the Highest Percentage of Population with a Degree in Liberal Arts and History in Gillette, WY with 5.3%.
What is the Percentage of Population with a Degree in Liberal Arts and History in Gillette, WY?
Percentage of Population with a Degree in Liberal Arts and History in Gillette is 5.2%.
What is the Percentage of Population with a Degree in Liberal Arts and History in Wyoming?
Percentage of Population with a Degree in Liberal Arts and History in Wyoming is 4.7%.
What is the Percentage of Population with a Degree in Liberal Arts and History in the United States?
Percentage of Population with a Degree in Liberal Arts and History in the United States is 4.9%.