Zip Codes with the Highest Percentage of Households with Income Above $100,000 in Green Bay, WI
RELATED REPORTS & OPTIONS
Household Income | $100k+
Green Bay
Compare Zip Codes
Map of Zip Codes with the Highest Percentage of Households with Income Above $100,000 in Green Bay
16.6%
53.4%
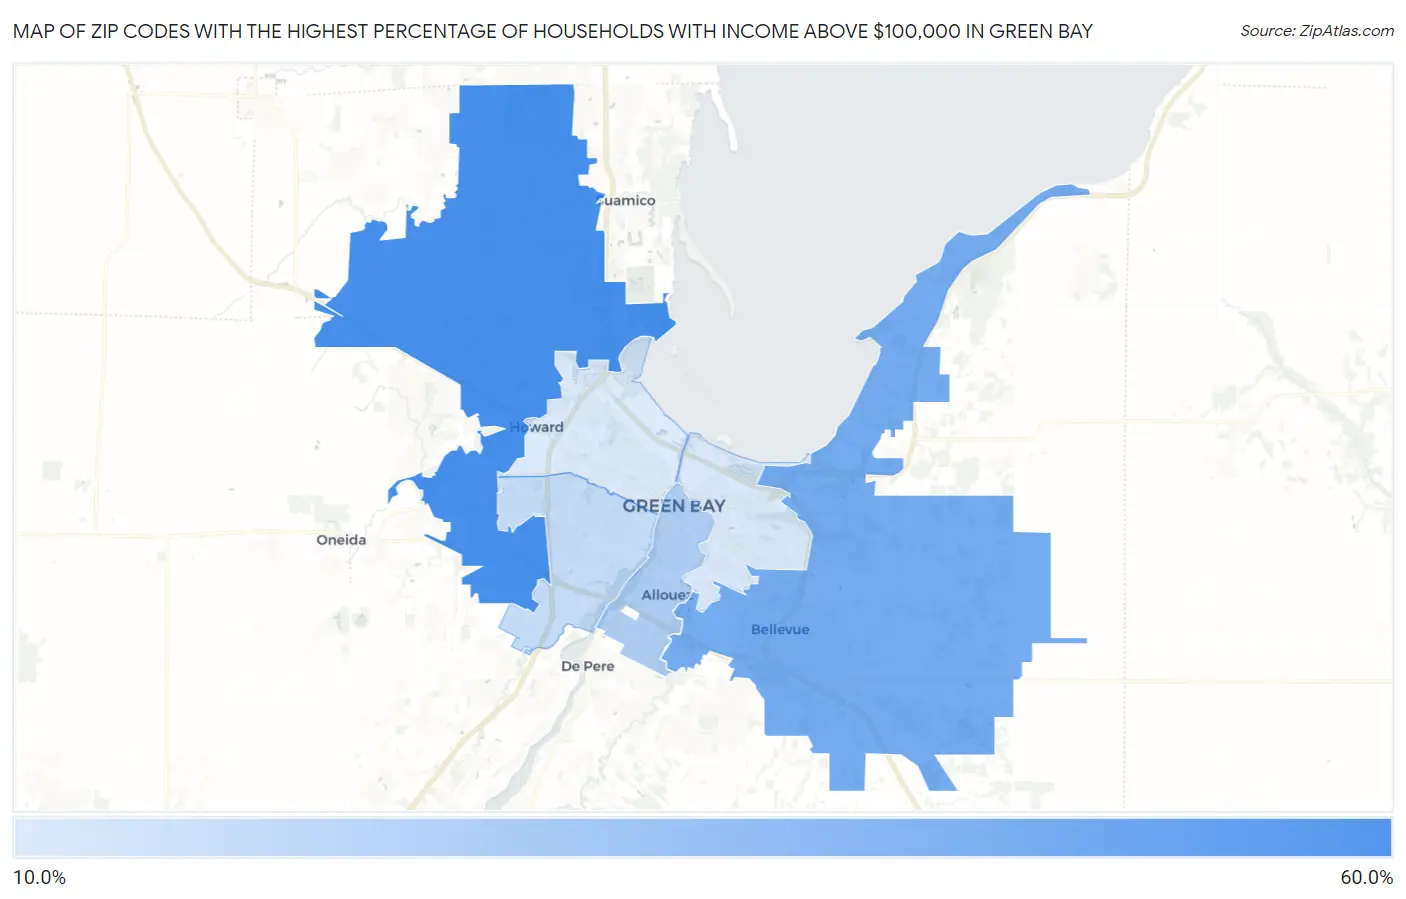
Zip Codes with the Highest Percentage of Households with Income Above $100,000 in Green Bay, WI
| Zip Code | Households with Income > $100k | vs State | vs National | |
| 1. | 54313 | 53.4% | 34.2%(+19.2)#42 | 37.3%(+16.1)#3,850 |
| 2. | 54311 | 40.7% | 34.2%(+6.50)#174 | 37.3%(+3.40)#8,549 |
| 3. | 54301 | 26.6% | 34.2%(-7.60)#531 | 37.3%(-10.7)#18,339 |
| 4. | 54304 | 21.4% | 34.2%(-12.8)#655 | 37.3%(-15.9)#22,893 |
| 5. | 54302 | 17.1% | 34.2%(-17.1)#707 | 37.3%(-20.2)#26,152 |
| 6. | 54303 | 16.6% | 34.2%(-17.6)#716 | 37.3%(-20.7)#26,495 |
1
Common Questions
What are the Top 5 Zip Codes with the Highest Percentage of Households with Income Above $100,000 in Green Bay, WI?
Top 5 Zip Codes with the Highest Percentage of Households with Income Above $100,000 in Green Bay, WI are:
What zip code has the Highest Percentage of Households with Income Above $100,000 in Green Bay, WI?
54313 has the Highest Percentage of Households with Income Above $100,000 in Green Bay, WI with 53.4%.
What is the Percentage of Households with Income Above $100,000 in Green Bay, WI?
Percentage of Households with Income Above $100,000 in Green Bay is 23.6%.
What is the Percentage of Households with Income Above $100,000 in Wisconsin?
Percentage of Households with Income Above $100,000 in Wisconsin is 34.2%.
What is the Percentage of Households with Income Above $100,000 in the United States?
Percentage of Households with Income Above $100,000 in the United States is 37.3%.