Zip Codes with the Highest Percentage of Population Employed in Food Preparation & Serving in Issaquah, WA
RELATED REPORTS & OPTIONS
Food Preparation & Serving
Issaquah
Compare Zip Codes
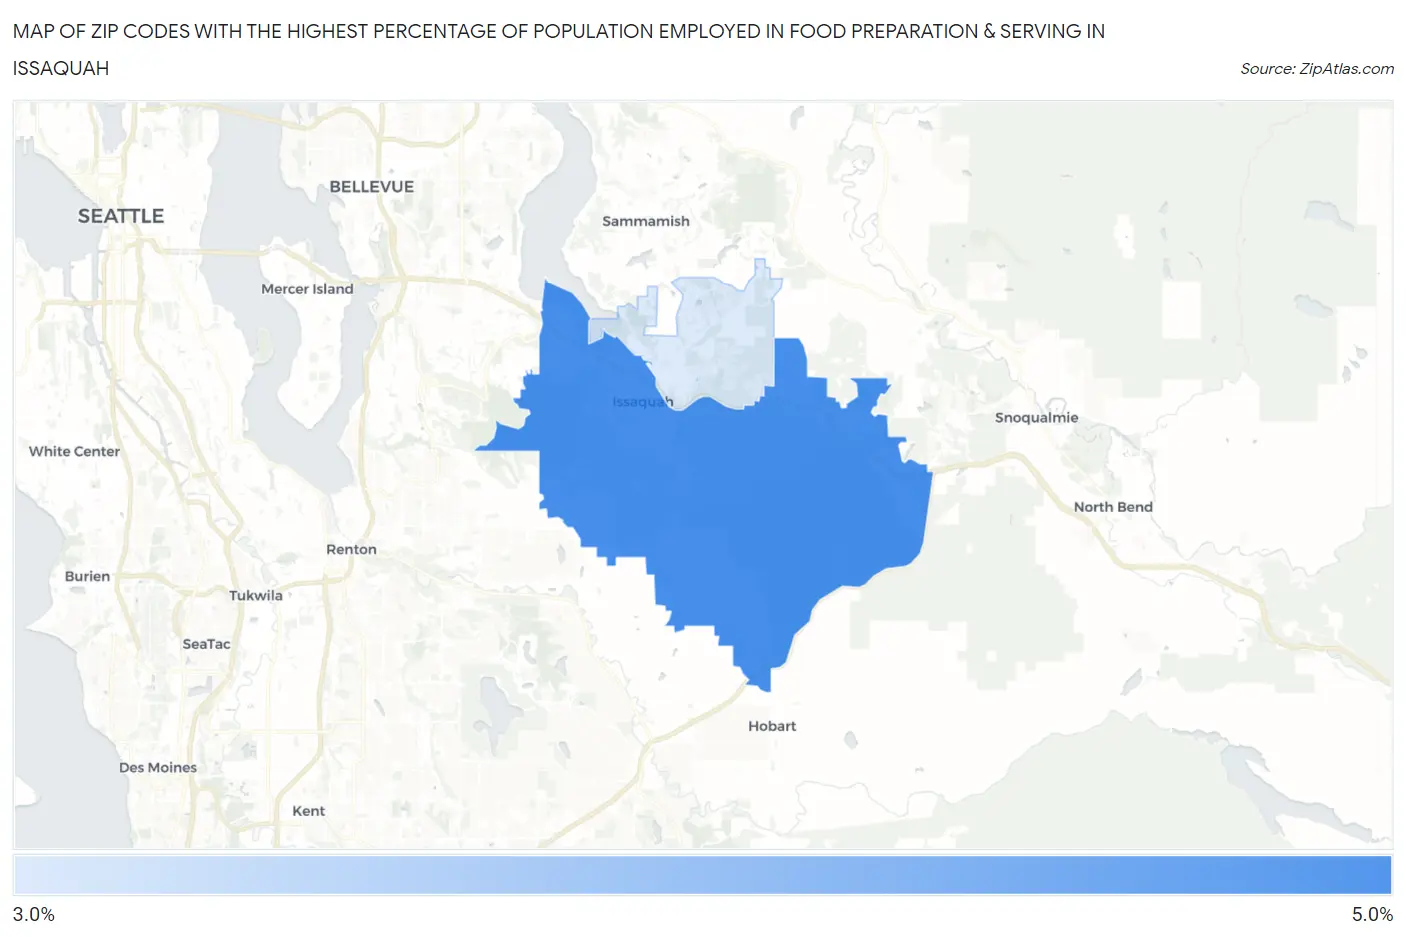
Map of Zip Codes with the Highest Percentage of Population Employed in Food Preparation & Serving in Issaquah
3.6%
4.1%
Zip Codes with the Highest Percentage of Population Employed in Food Preparation & Serving in Issaquah, WA
| Zip Code | % Employed | vs State | vs National | |
| 1. | 98027 | 4.1% | 5.1%(-1.08)#313 | 5.3%(-1.22)#16,858 |
| 2. | 98029 | 3.6% | 5.1%(-1.52)#348 | 5.3%(-1.66)#18,684 |
1
Common Questions
What are the Top Zip Codes with the Highest Percentage of Population Employed in Food Preparation & Serving in Issaquah, WA?
Top Zip Codes with the Highest Percentage of Population Employed in Food Preparation & Serving in Issaquah, WA are:
What zip code has the Highest Percentage of Population Employed in Food Preparation & Serving in Issaquah, WA?
98027 has the Highest Percentage of Population Employed in Food Preparation & Serving in Issaquah, WA with 4.1%.
What is the Percentage of Population Employed in Food Preparation & Serving in Issaquah, WA?
Percentage of Population Employed in Food Preparation & Serving in Issaquah is 3.1%.
What is the Percentage of Population Employed in Food Preparation & Serving in Washington?
Percentage of Population Employed in Food Preparation & Serving in Washington is 5.1%.
What is the Percentage of Population Employed in Food Preparation & Serving in the United States?
Percentage of Population Employed in Food Preparation & Serving in the United States is 5.3%.