Vietnamese vs Maltese No Vehicles in Household
COMPARE
Vietnamese
Maltese
No Vehicles in Household
No Vehicles in Household Comparison
Vietnamese
Maltese
26.2%
NO VEHICLES IN HOUSEHOLD
0.0/ 100
METRIC RATING
336th/ 347
METRIC RANK
9.1%
NO VEHICLES IN HOUSEHOLD
97.6/ 100
METRIC RATING
109th/ 347
METRIC RANK
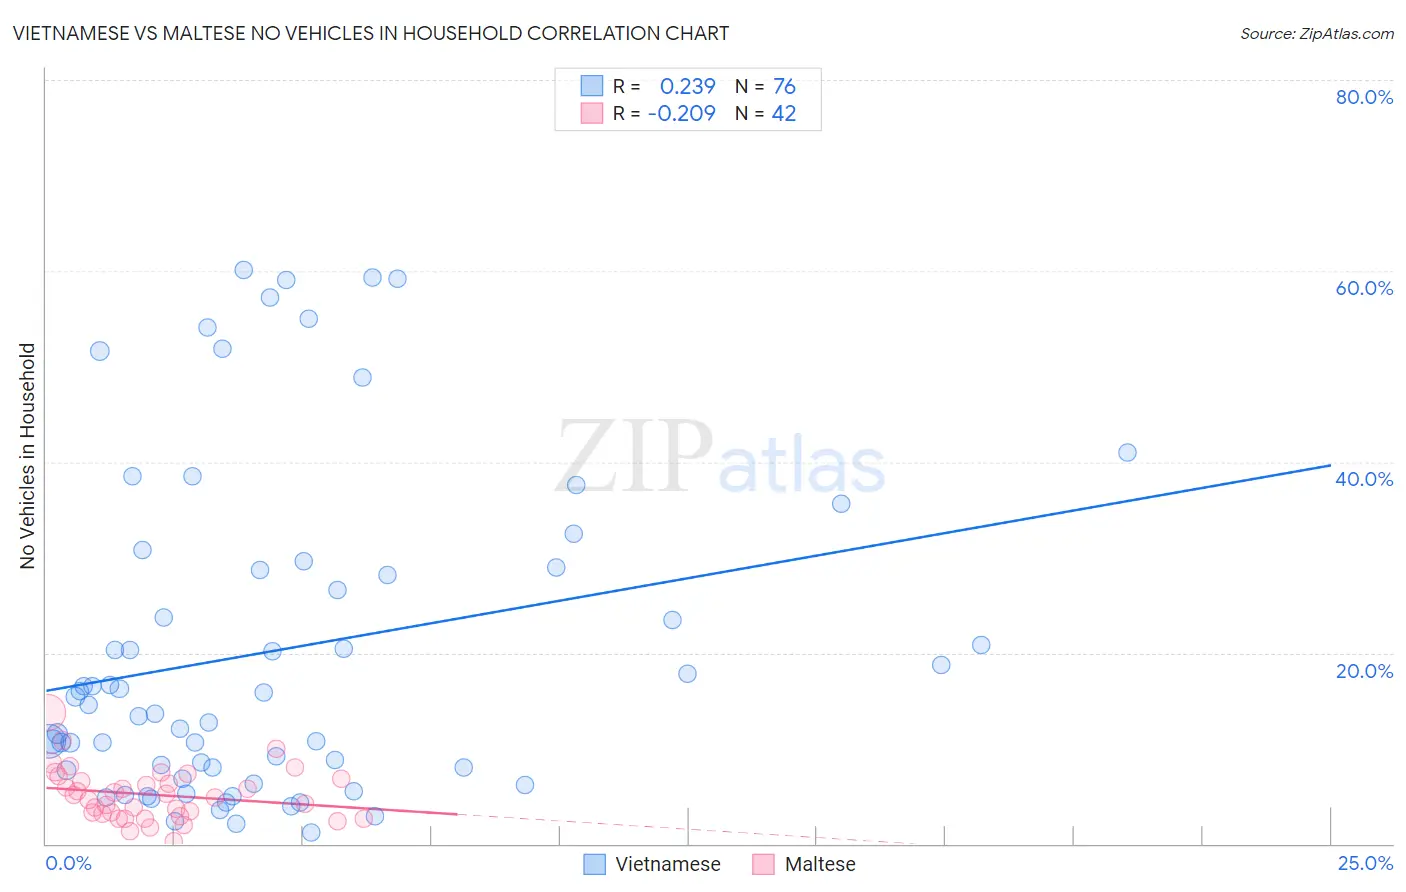
Vietnamese vs Maltese No Vehicles in Household Correlation Chart
The statistical analysis conducted on geographies consisting of 170,596,968 people shows a weak positive correlation between the proportion of Vietnamese and percentage of households with no vehicle available in the United States with a correlation coefficient (R) of 0.239 and weighted average of 26.2%. Similarly, the statistical analysis conducted on geographies consisting of 126,211,459 people shows a weak negative correlation between the proportion of Maltese and percentage of households with no vehicle available in the United States with a correlation coefficient (R) of -0.209 and weighted average of 9.1%, a difference of 188.1%.
No Vehicles in Household Correlation Summary
| Measurement | Vietnamese | Maltese |
| Minimum | 1.2% | 0.26% |
| Maximum | 60.1% | 13.7% |
| Range | 58.8% | 13.5% |
| Mean | 20.3% | 5.1% |
| Median | 15.0% | 5.0% |
| Interquartile 25% (IQ1) | 7.8% | 3.2% |
| Interquartile 75% (IQ3) | 28.8% | 6.8% |
| Interquartile Range (IQR) | 21.0% | 3.6% |
| Standard Deviation (Sample) | 16.9% | 2.7% |
| Standard Deviation (Population) | 16.8% | 2.7% |
Similar Demographics by No Vehicles in Household
Demographics Similar to Vietnamese by No Vehicles in Household
In terms of no vehicles in household, the demographic groups most similar to Vietnamese are Barbadian (26.1%, a difference of 0.56%), Immigrants from Uzbekistan (26.7%, a difference of 1.7%), Immigrants from Bangladesh (25.8%, a difference of 1.9%), Immigrants from Trinidad and Tobago (24.6%, a difference of 6.5%), and Immigrants from Ecuador (23.8%, a difference of 10.1%).
| Demographics | Rating | Rank | No Vehicles in Household |
| Ecuadorians | 0.0 /100 | #329 | Tragic 22.8% |
| West Indians | 0.0 /100 | #330 | Tragic 23.7% |
| Trinidadians and Tobagonians | 0.0 /100 | #331 | Tragic 23.7% |
| Immigrants | Ecuador | 0.0 /100 | #332 | Tragic 23.8% |
| Immigrants | Trinidad and Tobago | 0.0 /100 | #333 | Tragic 24.6% |
| Immigrants | Bangladesh | 0.0 /100 | #334 | Tragic 25.8% |
| Barbadians | 0.0 /100 | #335 | Tragic 26.1% |
| Vietnamese | 0.0 /100 | #336 | Tragic 26.2% |
| Immigrants | Uzbekistan | 0.0 /100 | #337 | Tragic 26.7% |
| Guyanese | 0.0 /100 | #338 | Tragic 29.3% |
| Dominicans | 0.0 /100 | #339 | Tragic 29.4% |
| Immigrants | Barbados | 0.0 /100 | #340 | Tragic 29.5% |
| Immigrants | Guyana | 0.0 /100 | #341 | Tragic 29.5% |
| British West Indians | 0.0 /100 | #342 | Tragic 29.7% |
| Inupiat | 0.0 /100 | #343 | Tragic 29.9% |
Demographics Similar to Maltese by No Vehicles in Household
In terms of no vehicles in household, the demographic groups most similar to Maltese are Mexican American Indian (9.1%, a difference of 0.13%), Hispanic or Latino (9.1%, a difference of 0.21%), Laotian (9.1%, a difference of 0.48%), Spanish American (9.1%, a difference of 0.57%), and Delaware (9.2%, a difference of 0.58%).
| Demographics | Rating | Rank | No Vehicles in Household |
| Yugoslavians | 98.3 /100 | #102 | Exceptional 9.0% |
| Seminole | 98.3 /100 | #103 | Exceptional 9.0% |
| Zimbabweans | 98.0 /100 | #104 | Exceptional 9.0% |
| Spanish Americans | 97.9 /100 | #105 | Exceptional 9.1% |
| Laotians | 97.8 /100 | #106 | Exceptional 9.1% |
| Hispanics or Latinos | 97.7 /100 | #107 | Exceptional 9.1% |
| Mexican American Indians | 97.6 /100 | #108 | Exceptional 9.1% |
| Maltese | 97.6 /100 | #109 | Exceptional 9.1% |
| Delaware | 97.2 /100 | #110 | Exceptional 9.2% |
| Immigrants | Kuwait | 95.1 /100 | #111 | Exceptional 9.4% |
| Armenians | 95.0 /100 | #112 | Exceptional 9.4% |
| Immigrants | Netherlands | 94.8 /100 | #113 | Exceptional 9.4% |
| Serbians | 94.3 /100 | #114 | Exceptional 9.4% |
| Navajo | 94.2 /100 | #115 | Exceptional 9.4% |
| Japanese | 94.1 /100 | #116 | Exceptional 9.4% |