Thai vs Iroquois 3 or more Vehicles in Household
COMPARE
Thai
Iroquois
3 or more Vehicles in Household
3 or more Vehicles in Household Comparison
Thais
Iroquois
19.8%
3 OR MORE VEHICLES IN HOUSEHOLD
71.1/ 100
METRIC RATING
156th/ 347
METRIC RANK
19.4%
3 OR MORE VEHICLES IN HOUSEHOLD
46.0/ 100
METRIC RATING
176th/ 347
METRIC RANK
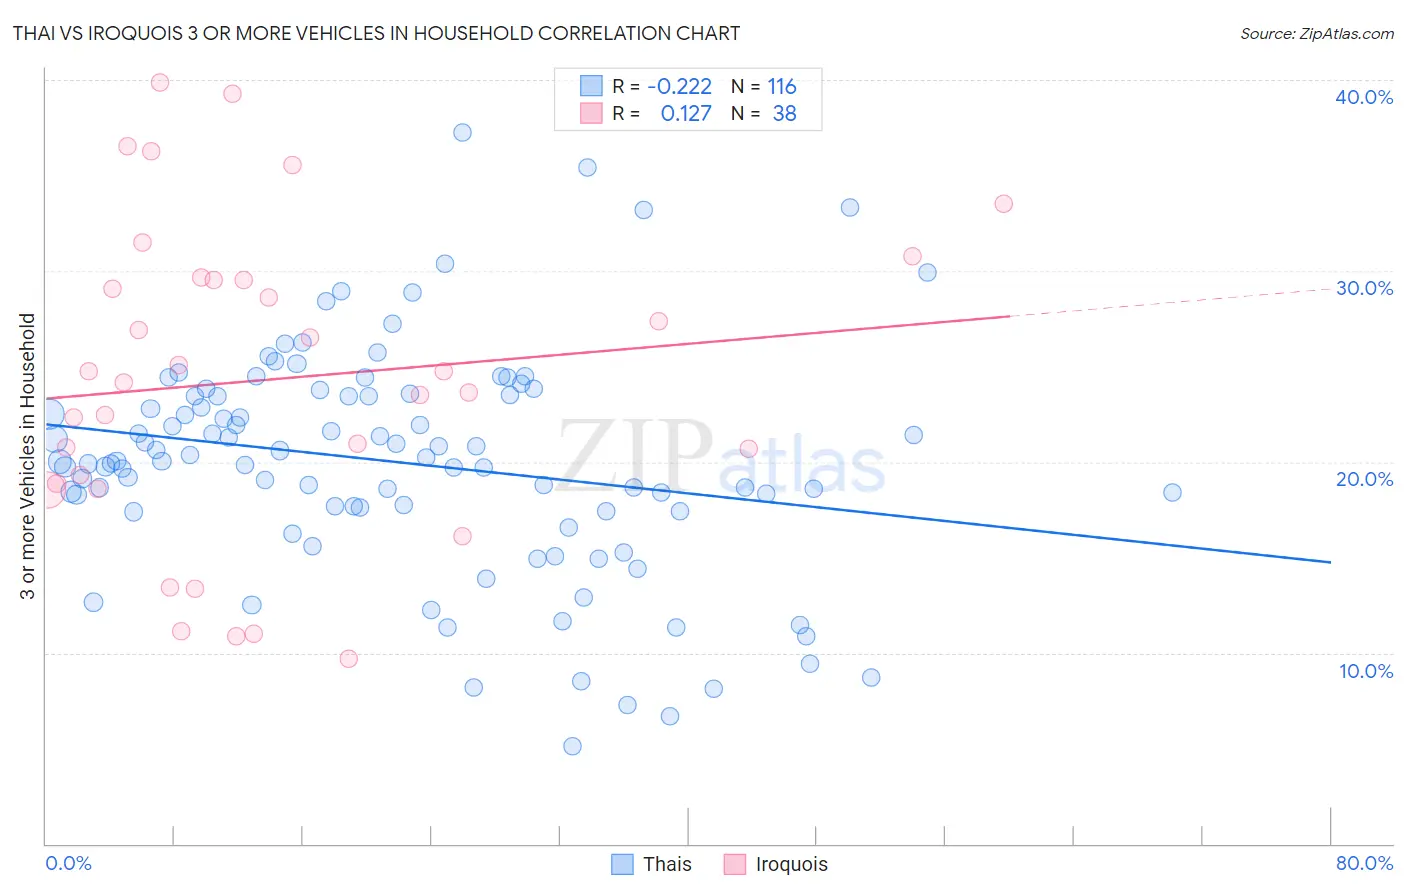
Thai vs Iroquois 3 or more Vehicles in Household Correlation Chart
The statistical analysis conducted on geographies consisting of 475,154,298 people shows a weak negative correlation between the proportion of Thais and percentage of households with 3 or more vehicles available in the United States with a correlation coefficient (R) of -0.222 and weighted average of 19.8%. Similarly, the statistical analysis conducted on geographies consisting of 207,225,565 people shows a poor positive correlation between the proportion of Iroquois and percentage of households with 3 or more vehicles available in the United States with a correlation coefficient (R) of 0.127 and weighted average of 19.4%, a difference of 2.0%.
3 or more Vehicles in Household Correlation Summary
| Measurement | Thai | Iroquois |
| Minimum | 5.1% | 9.7% |
| Maximum | 37.3% | 39.9% |
| Range | 32.2% | 30.2% |
| Mean | 20.0% | 24.3% |
| Median | 20.0% | 24.4% |
| Interquartile 25% (IQ1) | 17.5% | 18.9% |
| Interquartile 75% (IQ3) | 23.5% | 29.5% |
| Interquartile Range (IQR) | 6.0% | 10.6% |
| Standard Deviation (Sample) | 5.9% | 8.1% |
| Standard Deviation (Population) | 5.9% | 8.0% |
Demographics Similar to Thais and Iroquois by 3 or more Vehicles in Household
In terms of 3 or more vehicles in household, the demographic groups most similar to Thais are Hungarian (19.8%, a difference of 0.050%), Armenian (19.8%, a difference of 0.20%), Immigrants from Pakistan (19.8%, a difference of 0.26%), Immigrants from Lebanon (19.8%, a difference of 0.31%), and Immigrants from Guatemala (19.7%, a difference of 0.48%). Similarly, the demographic groups most similar to Iroquois are Syrian (19.5%, a difference of 0.070%), Immigrants from South Africa (19.5%, a difference of 0.30%), Immigrants from Northern Europe (19.5%, a difference of 0.32%), Kiowa (19.5%, a difference of 0.37%), and Immigrants from Western Europe (19.5%, a difference of 0.55%).
| Demographics | Rating | Rank | 3 or more Vehicles in Household |
| Thais | 71.1 /100 | #156 | Good 19.8% |
| Hungarians | 70.5 /100 | #157 | Good 19.8% |
| Armenians | 68.8 /100 | #158 | Good 19.8% |
| Immigrants | Pakistan | 68.2 /100 | #159 | Good 19.8% |
| Immigrants | Lebanon | 67.6 /100 | #160 | Good 19.8% |
| Immigrants | Guatemala | 65.6 /100 | #161 | Good 19.7% |
| Estonians | 63.2 /100 | #162 | Good 19.7% |
| Chileans | 63.0 /100 | #163 | Good 19.7% |
| Yugoslavians | 62.9 /100 | #164 | Good 19.7% |
| Immigrants | Costa Rica | 61.9 /100 | #165 | Good 19.7% |
| Immigrants | Cameroon | 60.9 /100 | #166 | Good 19.7% |
| Ukrainians | 58.9 /100 | #167 | Average 19.6% |
| Peruvians | 58.8 /100 | #168 | Average 19.6% |
| Immigrants | Denmark | 57.6 /100 | #169 | Average 19.6% |
| Iraqis | 56.0 /100 | #170 | Average 19.6% |
| Immigrants | Western Europe | 53.2 /100 | #171 | Average 19.5% |
| Kiowa | 50.9 /100 | #172 | Average 19.5% |
| Immigrants | Northern Europe | 50.2 /100 | #173 | Average 19.5% |
| Immigrants | South Africa | 50.0 /100 | #174 | Average 19.5% |
| Syrians | 47.0 /100 | #175 | Average 19.5% |
| Iroquois | 46.0 /100 | #176 | Average 19.4% |