Serbian vs Immigrants from Nepal No Vehicles in Household
COMPARE
Serbian
Immigrants from Nepal
No Vehicles in Household
No Vehicles in Household Comparison
Serbians
Immigrants from Nepal
9.4%
NO VEHICLES IN HOUSEHOLD
94.3/ 100
METRIC RATING
114th/ 347
METRIC RANK
10.5%
NO VEHICLES IN HOUSEHOLD
42.4/ 100
METRIC RATING
184th/ 347
METRIC RANK
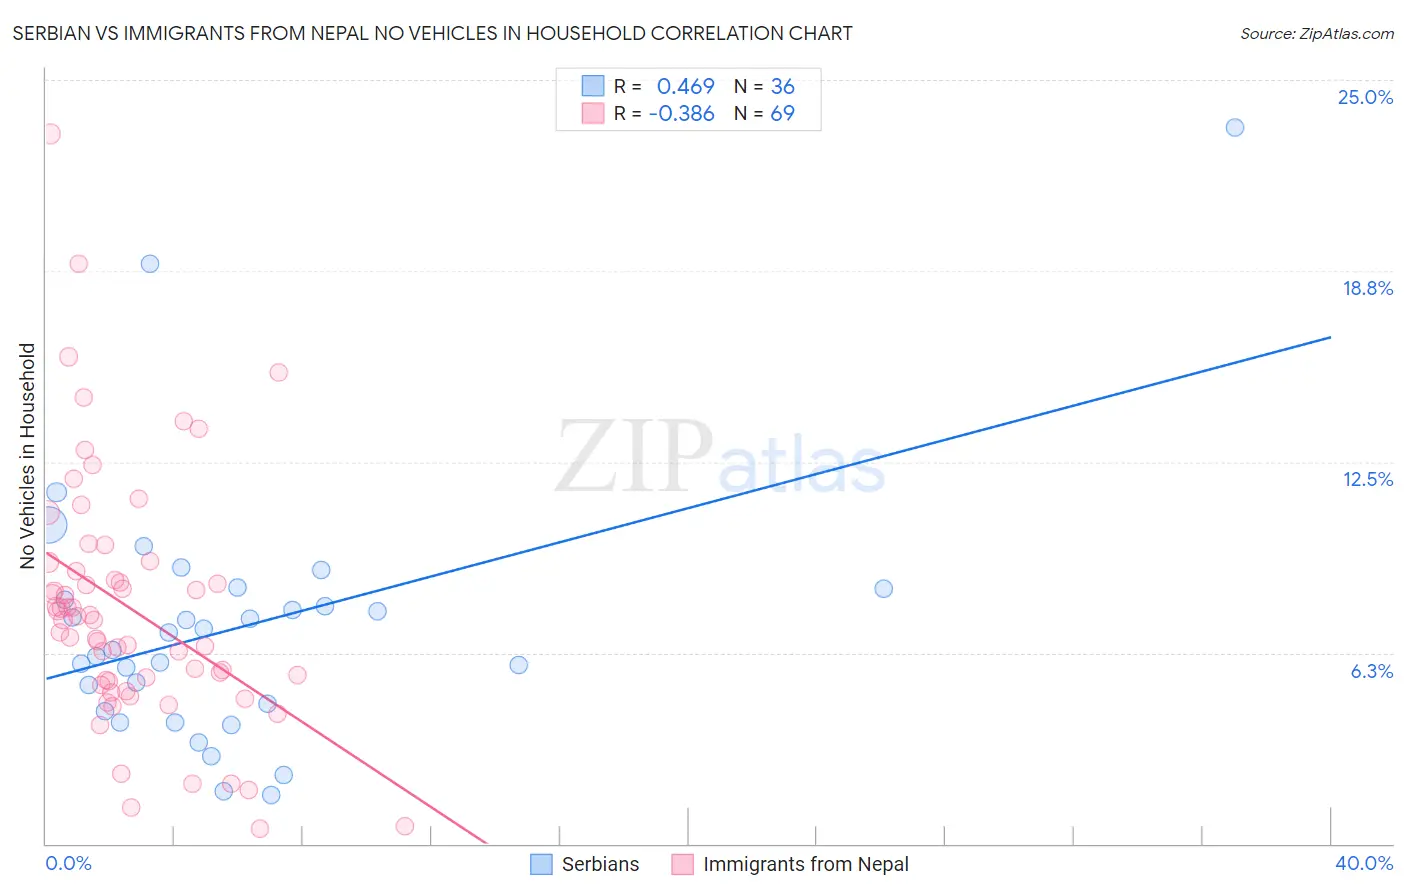
Serbian vs Immigrants from Nepal No Vehicles in Household Correlation Chart
The statistical analysis conducted on geographies consisting of 267,180,680 people shows a moderate positive correlation between the proportion of Serbians and percentage of households with no vehicle available in the United States with a correlation coefficient (R) of 0.469 and weighted average of 9.4%. Similarly, the statistical analysis conducted on geographies consisting of 186,377,991 people shows a mild negative correlation between the proportion of Immigrants from Nepal and percentage of households with no vehicle available in the United States with a correlation coefficient (R) of -0.386 and weighted average of 10.5%, a difference of 11.6%.
No Vehicles in Household Correlation Summary
| Measurement | Serbian | Immigrants from Nepal |
| Minimum | 1.6% | 0.50% |
| Maximum | 23.5% | 23.2% |
| Range | 21.9% | 22.7% |
| Mean | 7.1% | 7.7% |
| Median | 6.6% | 7.3% |
| Interquartile 25% (IQ1) | 4.5% | 5.3% |
| Interquartile 75% (IQ3) | 8.2% | 9.1% |
| Interquartile Range (IQR) | 3.7% | 3.8% |
| Standard Deviation (Sample) | 4.2% | 4.1% |
| Standard Deviation (Population) | 4.2% | 4.1% |
Similar Demographics by No Vehicles in Household
Demographics Similar to Serbians by No Vehicles in Household
In terms of no vehicles in household, the demographic groups most similar to Serbians are Navajo (9.4%, a difference of 0.070%), Japanese (9.4%, a difference of 0.13%), Chippewa (9.4%, a difference of 0.30%), Immigrants from Netherlands (9.4%, a difference of 0.43%), and Armenian (9.4%, a difference of 0.52%).
| Demographics | Rating | Rank | No Vehicles in Household |
| Hispanics or Latinos | 97.7 /100 | #107 | Exceptional 9.1% |
| Mexican American Indians | 97.6 /100 | #108 | Exceptional 9.1% |
| Maltese | 97.6 /100 | #109 | Exceptional 9.1% |
| Delaware | 97.2 /100 | #110 | Exceptional 9.2% |
| Immigrants | Kuwait | 95.1 /100 | #111 | Exceptional 9.4% |
| Armenians | 95.0 /100 | #112 | Exceptional 9.4% |
| Immigrants | Netherlands | 94.8 /100 | #113 | Exceptional 9.4% |
| Serbians | 94.3 /100 | #114 | Exceptional 9.4% |
| Navajo | 94.2 /100 | #115 | Exceptional 9.4% |
| Japanese | 94.1 /100 | #116 | Exceptional 9.4% |
| Chippewa | 93.8 /100 | #117 | Exceptional 9.4% |
| Greeks | 92.9 /100 | #118 | Exceptional 9.5% |
| Fijians | 92.7 /100 | #119 | Exceptional 9.5% |
| Immigrants | Thailand | 92.6 /100 | #120 | Exceptional 9.5% |
| Puget Sound Salish | 92.4 /100 | #121 | Exceptional 9.5% |
Demographics Similar to Immigrants from Nepal by No Vehicles in Household
In terms of no vehicles in household, the demographic groups most similar to Immigrants from Nepal are South American (10.5%, a difference of 0.070%), Native/Alaskan (10.5%, a difference of 0.17%), Immigrants from Bulgaria (10.5%, a difference of 0.19%), Immigrants from Colombia (10.5%, a difference of 0.23%), and German Russian (10.5%, a difference of 0.25%).
| Demographics | Rating | Rank | No Vehicles in Household |
| Immigrants | El Salvador | 49.1 /100 | #177 | Average 10.4% |
| Immigrants | Ethiopia | 48.0 /100 | #178 | Average 10.4% |
| Ethiopians | 45.8 /100 | #179 | Average 10.5% |
| Arabs | 45.3 /100 | #180 | Average 10.5% |
| Immigrants | Colombia | 44.1 /100 | #181 | Average 10.5% |
| Immigrants | Bulgaria | 43.8 /100 | #182 | Average 10.5% |
| Natives/Alaskans | 43.7 /100 | #183 | Average 10.5% |
| Immigrants | Nepal | 42.4 /100 | #184 | Average 10.5% |
| South Americans | 41.9 /100 | #185 | Average 10.5% |
| German Russians | 40.6 /100 | #186 | Average 10.5% |
| Immigrants | Poland | 38.4 /100 | #187 | Fair 10.6% |
| Immigrants | Armenia | 37.5 /100 | #188 | Fair 10.6% |
| Immigrants | Eritrea | 36.3 /100 | #189 | Fair 10.6% |
| Immigrants | North Macedonia | 34.6 /100 | #190 | Fair 10.6% |
| Immigrants | Northern Europe | 33.1 /100 | #191 | Fair 10.7% |