Polish vs Immigrants from Jordan 3 or more Vehicles in Household
COMPARE
Polish
Immigrants from Jordan
3 or more Vehicles in Household
3 or more Vehicles in Household Comparison
Poles
Immigrants from Jordan
20.2%
3 OR MORE VEHICLES IN HOUSEHOLD
87.3/ 100
METRIC RATING
134th/ 347
METRIC RANK
19.9%
3 OR MORE VEHICLES IN HOUSEHOLD
75.0/ 100
METRIC RATING
154th/ 347
METRIC RANK
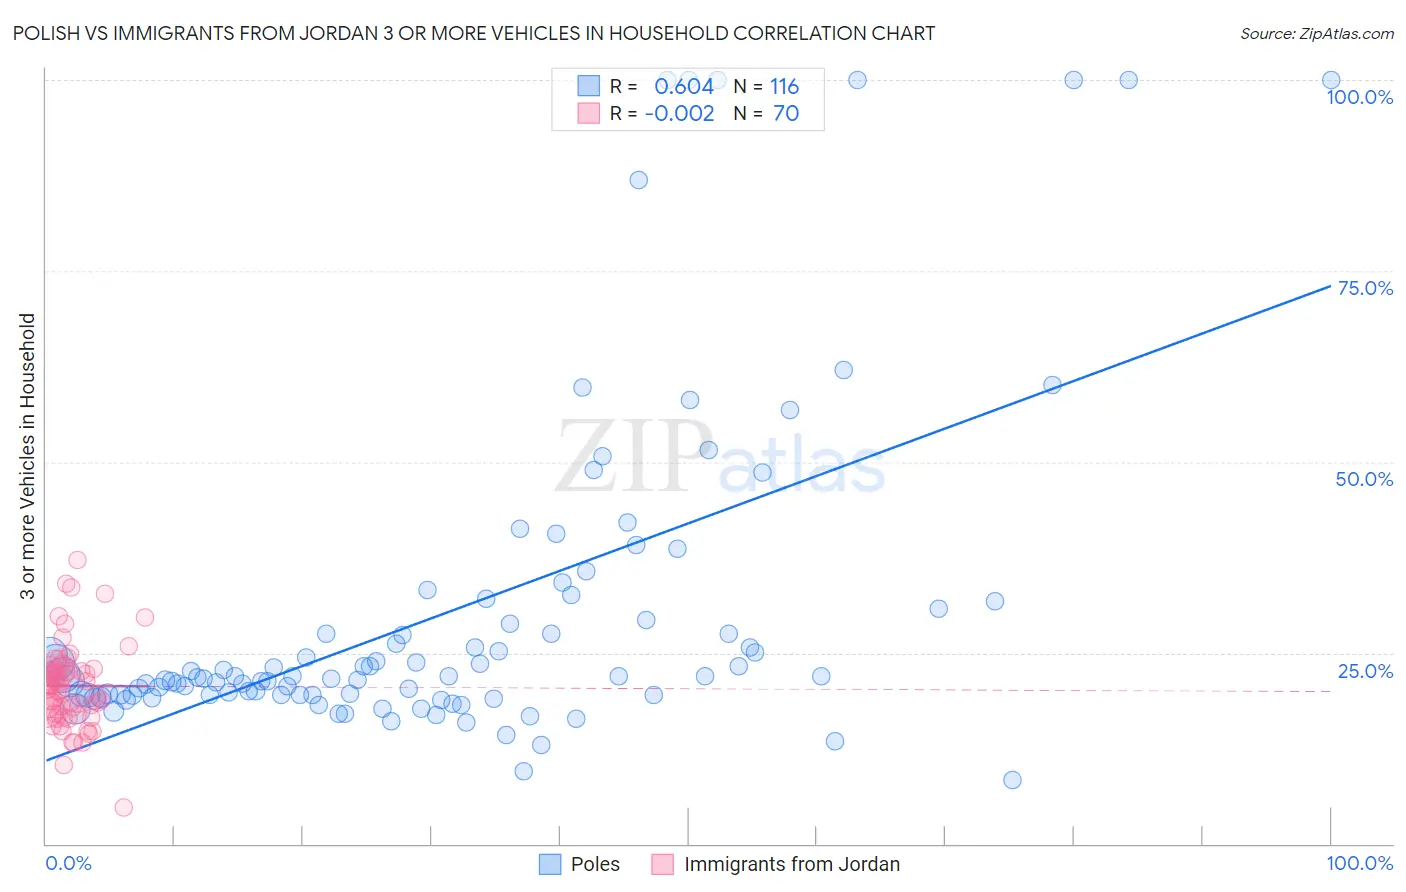
Polish vs Immigrants from Jordan 3 or more Vehicles in Household Correlation Chart
The statistical analysis conducted on geographies consisting of 559,689,592 people shows a significant positive correlation between the proportion of Poles and percentage of households with 3 or more vehicles available in the United States with a correlation coefficient (R) of 0.604 and weighted average of 20.2%. Similarly, the statistical analysis conducted on geographies consisting of 181,207,315 people shows no correlation between the proportion of Immigrants from Jordan and percentage of households with 3 or more vehicles available in the United States with a correlation coefficient (R) of -0.002 and weighted average of 19.9%, a difference of 1.5%.
3 or more Vehicles in Household Correlation Summary
| Measurement | Polish | Immigrants from Jordan |
| Minimum | 8.4% | 4.7% |
| Maximum | 100.0% | 37.1% |
| Range | 91.6% | 32.4% |
| Mean | 30.3% | 20.7% |
| Median | 21.9% | 20.8% |
| Interquartile 25% (IQ1) | 19.5% | 17.0% |
| Interquartile 75% (IQ3) | 30.0% | 22.8% |
| Interquartile Range (IQR) | 10.6% | 5.8% |
| Standard Deviation (Sample) | 21.4% | 5.5% |
| Standard Deviation (Population) | 21.3% | 5.5% |
Demographics Similar to Poles and Immigrants from Jordan by 3 or more Vehicles in Household
In terms of 3 or more vehicles in household, the demographic groups most similar to Poles are Immigrants from India (20.2%, a difference of 0.020%), Immigrants from Nicaragua (20.2%, a difference of 0.030%), Immigrants from Iraq (20.2%, a difference of 0.040%), Aleut (20.2%, a difference of 0.16%), and Slovene (20.2%, a difference of 0.28%). Similarly, the demographic groups most similar to Immigrants from Jordan are Yuman (19.9%, a difference of 0.060%), Lebanese (20.0%, a difference of 0.51%), Taiwanese (20.0%, a difference of 0.61%), Immigrants (20.0%, a difference of 0.62%), and Immigrants from Iran (20.0%, a difference of 0.64%).
| Demographics | Rating | Rank | 3 or more Vehicles in Household |
| Poles | 87.3 /100 | #134 | Excellent 20.2% |
| Immigrants | India | 87.2 /100 | #135 | Excellent 20.2% |
| Immigrants | Nicaragua | 87.1 /100 | #136 | Excellent 20.2% |
| Immigrants | Iraq | 87.1 /100 | #137 | Excellent 20.2% |
| Aleuts | 86.3 /100 | #138 | Excellent 20.2% |
| Slovenes | 85.5 /100 | #139 | Excellent 20.2% |
| French American Indians | 85.3 /100 | #140 | Excellent 20.1% |
| Ottawa | 84.9 /100 | #141 | Excellent 20.1% |
| Jordanians | 84.4 /100 | #142 | Excellent 20.1% |
| Lithuanians | 84.4 /100 | #143 | Excellent 20.1% |
| Iranians | 84.0 /100 | #144 | Excellent 20.1% |
| Palestinians | 83.9 /100 | #145 | Excellent 20.1% |
| Australians | 83.6 /100 | #146 | Excellent 20.1% |
| Slovaks | 83.0 /100 | #147 | Excellent 20.1% |
| Guatemalans | 82.6 /100 | #148 | Excellent 20.1% |
| Immigrants | Iran | 80.9 /100 | #149 | Excellent 20.0% |
| Immigrants | Immigrants | 80.8 /100 | #150 | Excellent 20.0% |
| Taiwanese | 80.6 /100 | #151 | Excellent 20.0% |
| Lebanese | 79.8 /100 | #152 | Good 20.0% |
| Yuman | 75.6 /100 | #153 | Good 19.9% |
| Immigrants | Jordan | 75.0 /100 | #154 | Good 19.9% |