Peruvian vs Slovene 2 or more Vehicles in Household

COMPARE

Peruvian
Race
Ancestry
AfghanAfricanAlaska NativeAlaskan AthabascanAlbanianAleutAlsatianAmericanApacheArabArapahoArgentineanArmenianAssyrian/Chaldean/SyriacAustralianAustrianBahamianBangladeshiBarbadianBasqueBelgianBelizeanBermudanBhutaneseBlackfeetBolivianBrazilianBritishBritish West IndianBulgarianBurmeseCajunCambodianCanadianCape VerdeanCarpatho RusynCelticCentral AmericanCentral American IndianCherokeeCheyenneChickasawChileanChineseChippewaChoctawColombianColvilleComancheCosta RicanCreeCreekCroatianCrowCubanCypriotCzechCzechoslovakianDanishDelawareDominicanDutchDutch West IndianEastern EuropeanEcuadorianEgyptianEnglishEstonianEthiopianEuropeanFijianFilipinoFinnishFrenchFrench American IndianFrench CanadianGermanGerman RussianGhanaianGreekGuamanian/ChamorroGuatemalanGuyaneseHaitianHmongHonduranHopiHoumaHungarianIcelanderIndian (Asian)IndonesianInupiatIranianIraqiIrishIroquoisIsraeliItalianJamaicanJapaneseJordanianKenyanKiowaKoreanLaotianLatvianLebaneseLiberianLithuanianLumbeeLuxembourgerMacedonianMalaysianMalteseMarshalleseMenomineeMexicanMexican American IndianMongolianMoroccanNative HawaiianNavajoNepaleseNew ZealanderNicaraguanNigerianNorthern EuropeanNorwegianOkinawanOsageOttawaPaiutePakistaniPalestinianPanamanianParaguayanPennsylvania GermanPeruvianPimaPolishPortuguesePotawatomiPuebloPuerto RicanPuget Sound SalishRomanianRussianSalvadoranSamoanScandinavianScotch-IrishScottishSeminoleSenegaleseSerbianShoshoneSierra LeoneanSiouxSlavicSlovakSomaliSouth AfricanSouth AmericanSouth American IndianSoviet UnionSpaniardSpanishSpanish AmericanSpanish American IndianSri LankanSubsaharan AfricanSudaneseSwedishSwissSyrianTaiwaneseThaiTlingit-HaidaTohono O'OdhamTonganTrinidadian and TobagonianTsimshianTurkishU.S. Virgin IslanderUgandanUkrainianUruguayanUteVenezuelanVietnameseWelshWest IndianYakamaYaquiYugoslavianYumanYup'ikZimbabwean
Immigration
NonimmigrantsImmigrantsAfghanistanAfricaAlbaniaArgentinaArmeniaAsiaAustraliaAustriaBahamasBangladeshBarbadosBelarusBelgiumBelizeBoliviaBosnia and HerzegovinaBrazilBulgariaBurma/MyanmarCabo VerdeCambodiaCameroonCanadaCaribbeanCentral AmericaChileChinaColombiaCongoCosta RicaCroatiaCubaCzechoslovakiaDenmarkDominicaDominican RepublicEastern AfricaEastern AsiaEastern EuropeEcuadorEgyptEl SalvadorEnglandEritreaEthiopiaEuropeFijiFranceGermanyGhanaGreeceGrenadaGuatemalaGuyanaHaitiHondurasHong KongHungaryIndiaIndonesiaIranIraqIrelandIsraelItalyJamaicaJapanJordanKazakhstanKenyaKoreaKuwaitLaosLatin AmericaLatviaLebanonLiberiaLithuaniaMalaysiaMexicoMicronesiaMiddle AfricaMoldovaMoroccoNepalNetherlandsNicaraguaNigeriaNorth AmericaNorth MacedoniaNorthern AfricaNorthern EuropeNorwayOceaniaPakistanPanamaPeruPhilippinesPolandPortugalRomaniaRussiaSaudi ArabiaScotlandSenegalSerbiaSierra LeoneSingaporeSomaliaSouth AfricaSouth AmericaSouth Central AsiaSouth Eastern AsiaSouthern EuropeSpainSri LankaSt. Vincent and the GrenadinesSudanSwedenSwitzerlandSyriaTaiwanThailandTrinidad and TobagoTurkeyUgandaUkraineUruguayUzbekistanVenezuelaVietnamWest IndiesWestern AfricaWestern AsiaWestern EuropeYemenZaireZimbabweAzores
Slovene
Race
Ancestry
AfghanAfricanAlaska NativeAlaskan AthabascanAlbanianAleutAlsatianAmericanApacheArabArapahoArgentineanArmenianAssyrian/Chaldean/SyriacAustralianAustrianBahamianBangladeshiBarbadianBasqueBelgianBelizeanBermudanBhutaneseBlackfeetBolivianBrazilianBritishBritish West IndianBulgarianBurmeseCajunCambodianCanadianCape VerdeanCarpatho RusynCelticCentral AmericanCentral American IndianCherokeeCheyenneChickasawChileanChineseChippewaChoctawColombianColvilleComancheCosta RicanCreeCreekCroatianCrowCubanCypriotCzechCzechoslovakianDanishDelawareDominicanDutchDutch West IndianEastern EuropeanEcuadorianEgyptianEnglishEstonianEthiopianEuropeanFijianFilipinoFinnishFrenchFrench American IndianFrench CanadianGermanGerman RussianGhanaianGreekGuamanian/ChamorroGuatemalanGuyaneseHaitianHmongHonduranHopiHoumaHungarianIcelanderIndian (Asian)IndonesianInupiatIranianIraqiIrishIroquoisIsraeliItalianJamaicanJapaneseJordanianKenyanKiowaKoreanLaotianLatvianLebaneseLiberianLithuanianLumbeeLuxembourgerMacedonianMalaysianMalteseMarshalleseMenomineeMexicanMexican American IndianMongolianMoroccanNative HawaiianNavajoNepaleseNew ZealanderNicaraguanNigerianNorthern EuropeanNorwegianOkinawanOsageOttawaPaiutePakistaniPalestinianPanamanianParaguayanPennsylvania GermanPimaPolishPortuguesePotawatomiPuebloPuerto RicanPuget Sound SalishRomanianRussianSalvadoranSamoanScandinavianScotch-IrishScottishSeminoleSenegaleseSerbianShoshoneSierra LeoneanSiouxSlavicSlovakSloveneSomaliSouth AfricanSouth AmericanSouth American IndianSoviet UnionSpaniardSpanishSpanish AmericanSpanish American IndianSri LankanSubsaharan AfricanSudaneseSwedishSwissSyrianTaiwaneseThaiTlingit-HaidaTohono O'OdhamTonganTrinidadian and TobagonianTsimshianTurkishU.S. Virgin IslanderUgandanUkrainianUruguayanUteVenezuelanVietnameseWelshWest IndianYakamaYaquiYugoslavianYumanYup'ikZimbabwean
Immigration
NonimmigrantsImmigrantsAfghanistanAfricaAlbaniaArgentinaArmeniaAsiaAustraliaAustriaBahamasBangladeshBarbadosBelarusBelgiumBelizeBoliviaBosnia and HerzegovinaBrazilBulgariaBurma/MyanmarCabo VerdeCambodiaCameroonCanadaCaribbeanCentral AmericaChileChinaColombiaCongoCosta RicaCroatiaCubaCzechoslovakiaDenmarkDominicaDominican RepublicEastern AfricaEastern AsiaEastern EuropeEcuadorEgyptEl SalvadorEnglandEritreaEthiopiaEuropeFijiFranceGermanyGhanaGreeceGrenadaGuatemalaGuyanaHaitiHondurasHong KongHungaryIndiaIndonesiaIranIraqIrelandIsraelItalyJamaicaJapanJordanKazakhstanKenyaKoreaKuwaitLaosLatin AmericaLatviaLebanonLiberiaLithuaniaMalaysiaMexicoMicronesiaMiddle AfricaMoldovaMoroccoNepalNetherlandsNicaraguaNigeriaNorth AmericaNorth MacedoniaNorthern AfricaNorthern EuropeNorwayOceaniaPakistanPanamaPeruPhilippinesPolandPortugalRomaniaRussiaSaudi ArabiaScotlandSenegalSerbiaSierra LeoneSingaporeSomaliaSouth AfricaSouth AmericaSouth Central AsiaSouth Eastern AsiaSouthern EuropeSpainSri LankaSt. Vincent and the GrenadinesSudanSwedenSwitzerlandSyriaTaiwanThailandTrinidad and TobagoTurkeyUgandaUkraineUruguayUzbekistanVenezuelaVietnamWest IndiesWestern AfricaWestern AsiaWestern EuropeYemenZaireZimbabweAzores
2 or more Vehicles in Household
Income
Poverty
Unemployment
Labor Participation
Family Structure
Vehicle Availability
Education Level
Disability

2 or more Vehicles in Household Comparison

Peruvians

Slovenes

Fair
Exceptional
55.0%
2 OR MORE VEHICLES IN HOUSEHOLD
33.7/ 100
METRIC RATING
186th/ 347
METRIC RANK
58.3%
2 OR MORE VEHICLES IN HOUSEHOLD
99.5/ 100
METRIC RATING
77th/ 347
METRIC RANK

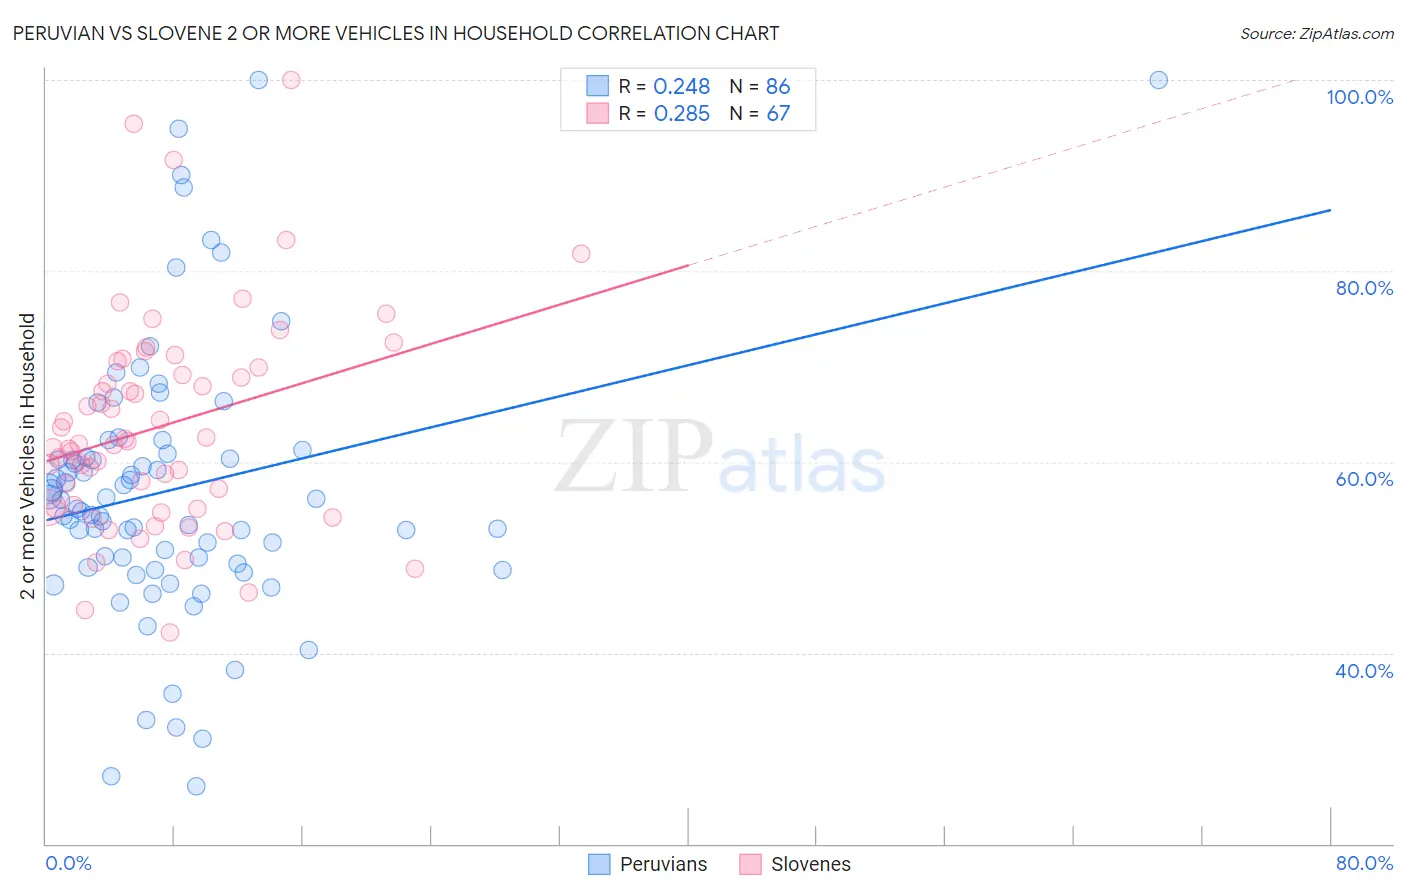
Peruvian vs Slovene 2 or more Vehicles in Household Correlation Chart

The statistical analysis conducted on geographies consisting of 363,025,194 people shows a weak positive correlation between the proportion of Peruvians and percentage of households with 2 or more vehicles available in the United States with a correlation coefficient (R) of 0.248 and weighted average of 55.0%. Similarly, the statistical analysis conducted on geographies consisting of 261,272,828 people shows a weak positive correlation between the proportion of Slovenes and percentage of households with 2 or more vehicles available in the United States with a correlation coefficient (R) of 0.285 and weighted average of 58.3%, a difference of 6.0%.
Peruvian vs Slovene 2 or more Vehicles in Household

2 or more Vehicles in Household Correlation Summary

MeasurementPeruvianSlovene
Minimum26.0%42.1%
Maximum100.0%100.0%
Range74.0%57.9%
Mean57.1%63.7%
Median55.6%61.9%
Interquartile 25% (IQ1)49.4%55.3%
Interquartile 75% (IQ3)60.9%69.9%
Interquartile Range (IQR)11.5%14.6%
Standard Deviation (Sample)14.3%11.2%
Standard Deviation (Population)14.2%11.1%

Similar Demographics by 2 or more Vehicles in Household

Demographics Similar to Peruvians by 2 or more Vehicles in Household

In terms of 2 or more vehicles in household, the demographic groups most similar to Peruvians are Immigrants from Uganda (55.0%, a difference of 0.010%), Arab (55.0%, a difference of 0.10%), Apache (55.1%, a difference of 0.13%), Marshallese (54.9%, a difference of 0.15%), and Immigrants from Cameroon (55.1%, a difference of 0.16%).
DemographicsRating | Rank2 or more Vehicles in Household
Alaskan Athabascans
42.9
/100
|
#179
Average
55.2%
Immigrants | Kenya
40.4
/100
|
#180
Average
55.1%
Immigrants | Micronesia
38.2
/100
|
#181
Fair
55.1%
Cree
38.2
/100
|
#182
Fair
55.1%
Immigrants | Cameroon
37.3
/100
|
#183
Fair
55.1%
Apache
36.7
/100
|
#184
Fair
55.1%
Arabs
35.9
/100
|
#185
Fair
55.0%
Peruvians
33.7
/100
|
#186
Fair
55.0%
Immigrants | Uganda
33.4
/100
|
#187
Fair
55.0%
Marshallese
30.5
/100
|
#188
Fair
54.9%
Eastern Europeans
27.5
/100
|
#189
Fair
54.8%
Russians
26.3
/100
|
#190
Fair
54.8%
Immigrants | Immigrants
25.0
/100
|
#191
Fair
54.7%
Immigrants | Romania
23.8
/100
|
#192
Fair
54.7%
Immigrants | Japan
23.4
/100
|
#193
Fair
54.7%

Demographics Similar to Slovenes by 2 or more Vehicles in Household

In terms of 2 or more vehicles in household, the demographic groups most similar to Slovenes are Creek (58.3%, a difference of 0.010%), Polish (58.3%, a difference of 0.040%), Lithuanian (58.2%, a difference of 0.050%), Bolivian (58.3%, a difference of 0.12%), and Immigrants from Afghanistan (58.3%, a difference of 0.12%).
DemographicsRating | Rank2 or more Vehicles in Household
Italians
99.6
/100
|
#70
Exceptional
58.4%
Bangladeshis
99.6
/100
|
#71
Exceptional
58.4%
Austrians
99.6
/100
|
#72
Exceptional
58.4%
Bolivians
99.6
/100
|
#73
Exceptional
58.3%
Immigrants | Afghanistan
99.6
/100
|
#74
Exceptional
58.3%
Poles
99.5
/100
|
#75
Exceptional
58.3%
Creek
99.5
/100
|
#76
Exceptional
58.3%
Slovenes
99.5
/100
|
#77
Exceptional
58.3%
Lithuanians
99.5
/100
|
#78
Exceptional
58.2%
Delaware
99.4
/100
|
#79
Exceptional
58.2%
Immigrants | England
99.3
/100
|
#80
Exceptional
58.1%
Immigrants | Iraq
99.3
/100
|
#81
Exceptional
58.1%
Iranians
99.3
/100
|
#82
Exceptional
58.1%
Icelanders
99.2
/100
|
#83
Exceptional
58.0%
Maltese
99.2
/100
|
#84
Exceptional
58.0%